RELEASE DETAILS
| Version Number | 3.0 |
| Release Month | February , 2024 |
| Release Size (KB/MB/GB) | 10.3 MB |
The iControl product provides business context to operational events by linking applications, business units, and products to a business process flow delivering products or services to an endpoint. It resolves the challenges with data sanity/accuracy to enhance the performance observability and add predictive analytics through machine learning and a growing list of dashboard widgets. The following document details changes within the release (version above). There are several new features in this release as documented below.
These notes relate to the major release version 3.0.0, in which over 324 development tasks have been delivered, and at the same time updated any underlying 3rd party component libraries required to facilitate new feature development, remove security vulnerabilities, and comply with release compliance guidelines.
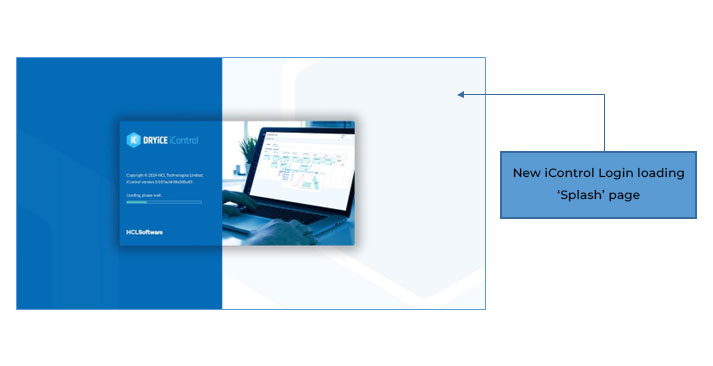
As well as the new ‘Splash’ loading screen (shown above) and over 100 ‘Bug’ fixes and improvements, these are the key features delivered within this release as follows:
- Amber ‘warning’ thresholds – the ability to set an early warning alert of impending KPI or SLA breaches.
- New and improved cut-off Swimlane ‘Current status’ widget including awareness of ‘Late’ events.
- New refactored Flow Designer tool including improved control over link paths and visualisations.
- New cut-off and uptime observation widgets as well as improved count, duration, and throughput observation widgets.
- Import/Export Data Streams feature for moving objects between environments.
- Data model for ad-hoc reporting.
iControl is already armed with two early warning systems to help reduce the incidents of full Target breaches:
- Predictive warnings (Splunk only) – which employs the Splunk Machine Learning Toolkit to predict future events and warn of potential future breaches within the current Target monitoring period.
- Dependency warnings – where, based on a relational rule set, warnings of potential breach can be determined based on the status of Target breaches ‘upstream’ within the process Flow, that are known to have an impact on the ‘downstream’ Targets ability to operate within the agreed KPI/SLA thresholds.
In addition, we have added Threshold warnings, configured individually within each Target these are early warnings that the event/value being monitored is ‘heading’ towards a breach.
For example, where the breach threshold by which a file must arrive must be by 5:00 pm, we now can set a warning threshold for this Target of, say 4:00 pm. On receipt of a warning, it then gives the Operations team time to resolve any issue and ensure the file arrives on time so the monitored KPI/SLA is not breached.
Another example would be where the number of records on a queue (to be processed) has a maximum limit capacity threshold of 500 records, we now can set a warning threshold of 400 records to (hopefully) give the operations team time to resolve the issue and stop the queue growing any further.
To facilitate Warning (Amber) thresholds the Target Create/Edit form has been redesigned to both streamline the process and also to create better visualization of the Target configuration (greater than, less than, etc.).
An example of the cut-off threshold definition form is shown below, showing the improved visualization representing the Breach and Warning thresholds timeline with respect to the monitoring duration:
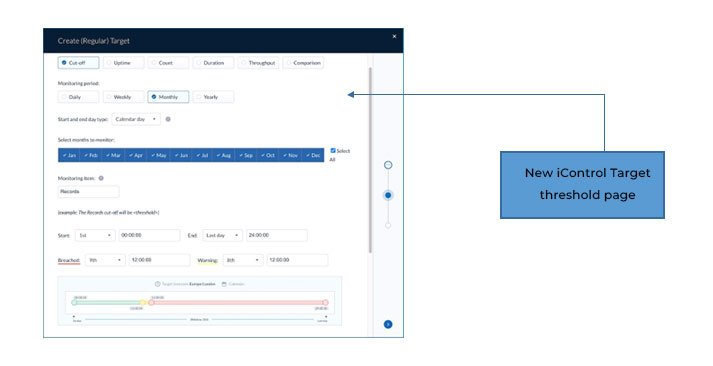
Note: The visualization used within the Create/Edit form is the same as the visualization that will appear within the observation widget on a dashboard or as part of the rollout details within the Target Performance page.
Here is an example of the count Target threshold definition form, showing multiple thresholds configured at different times within the associated monitoring period:
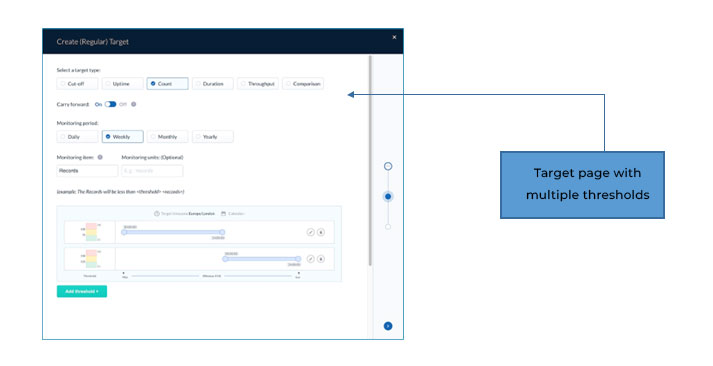
As you can see in the image above, numerical targets (counts, durations, throughputs) now include both threshold and active period visualizations that fully communicate the Target configuration.
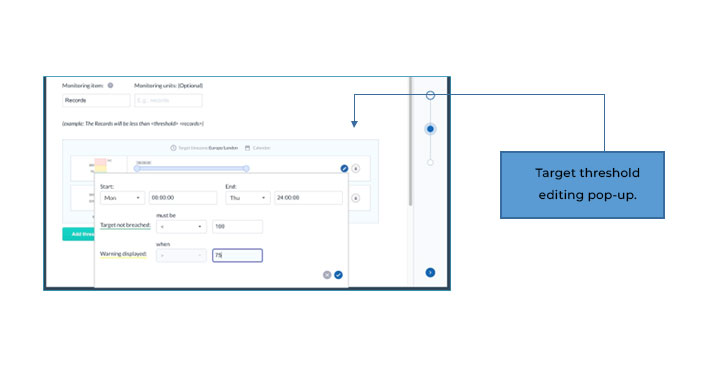
All Target types except cut-offs can have multiple monitoring periods with different thresholds, editing these through pop-up form as shown below:
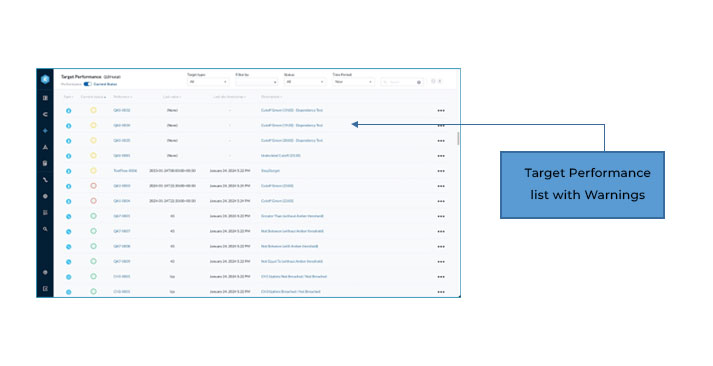
Once Warning thresholds are configured, they are visible within the Target Performance lists detailing current status reporting, as shown below:
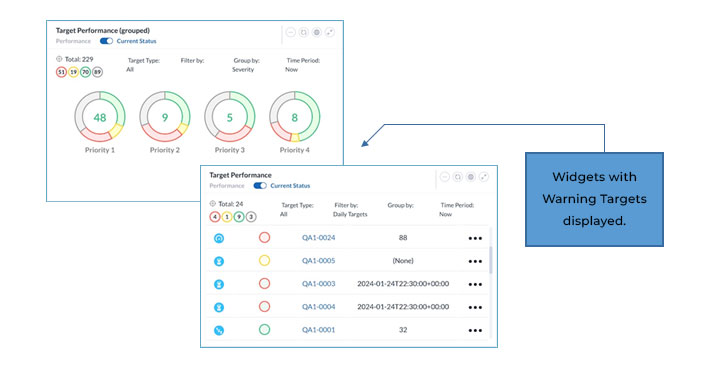
Warnings are also visible within current status reporting within all real-time reporting widgets displaying current status within active monitoring periods, example summary and list widgets shown below:
Visibility of Warnings within Target detail rollouts and observation widgets will be covered in the next section.
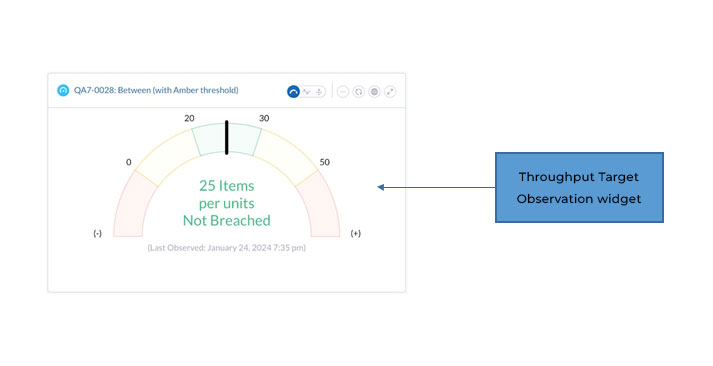
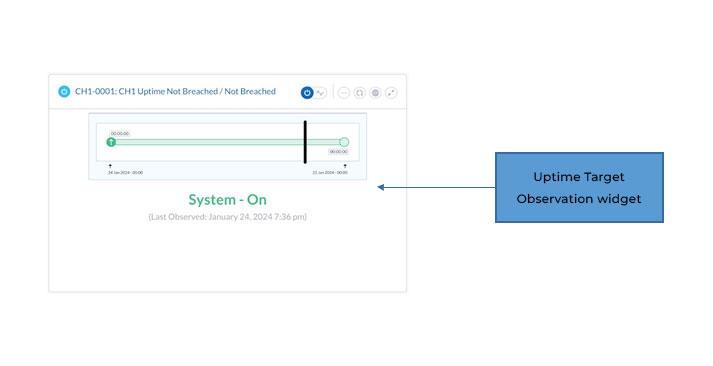
All the observation widgets have been either replaced with new visualizations or the existing widget visualization improved to better align with the Cumulative/Current status reporting.
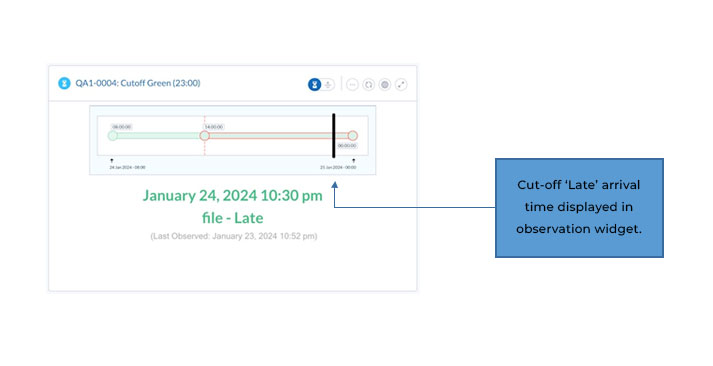
If a Target has arrived but ‘Late’ clients have requested that these are indicated as such on the Target Performance lists, drill-downs, observation widgets, and on the Cut-off Swimlane widget.
Originally the Cut-off Swimlane widget was implemented as a cumulative Target Performance report, this has been enhanced to allow for the selection of two versions, Cumulative and Current status. ‘Late’ Targets are visible on the Current status version as shown below.
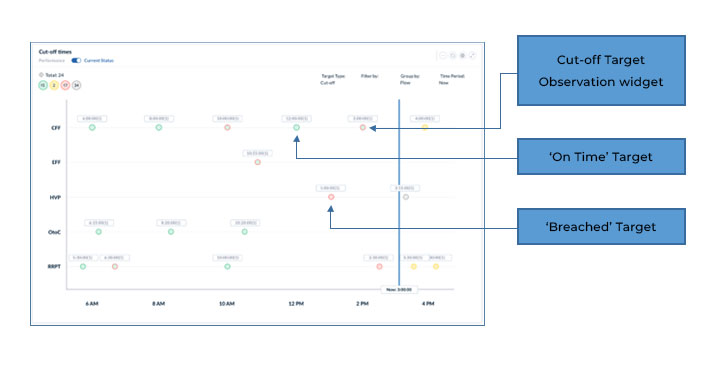
As you can see above events that have been completed but arrived/resolved ‘Late’ are displayed as a green dot/time mark with a red outline, whereas an ‘on time’ event is displayed with a green outline.
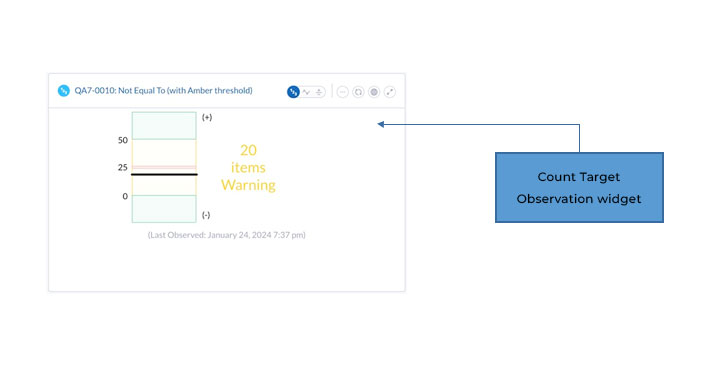
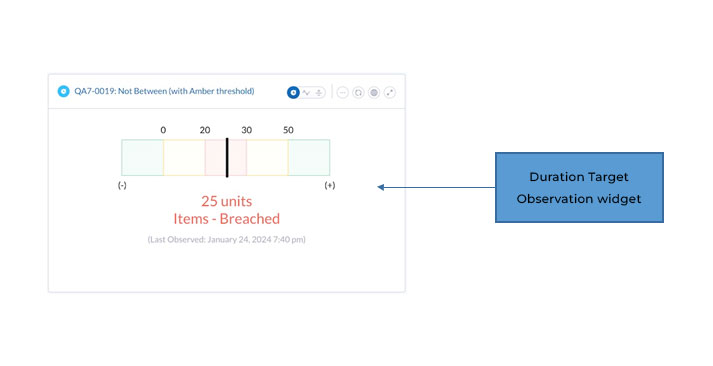
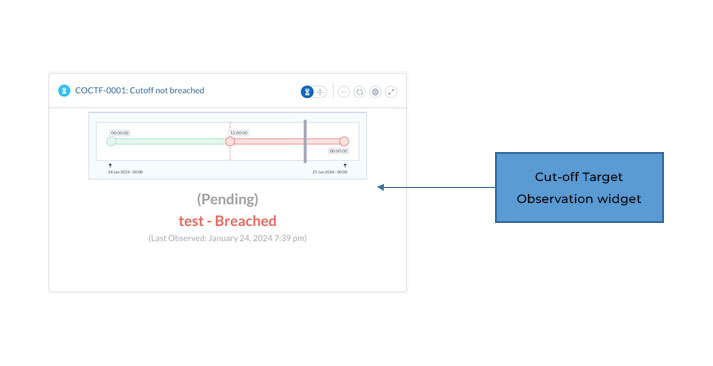
This Green/Red combination is also used as a ‘Late’ indicator within Target lists and drill-downs, and ‘Late’ Targets are displayed within the observation widget as shown below:
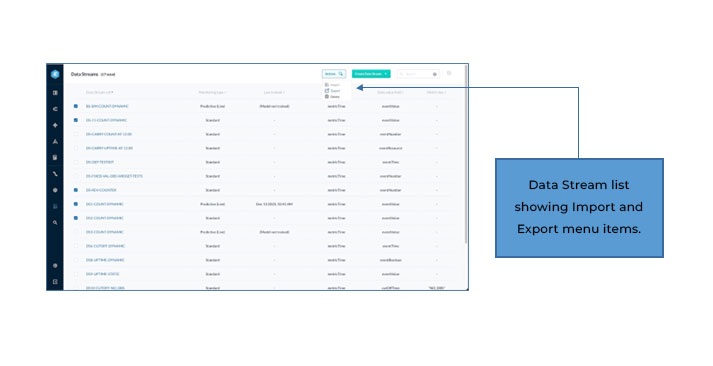
The ability to export and then import Data Streams from one environment to another. This was introduced for Flows (with Targets) in release 2.5 and has now also been implemented for Data Streams to allow the full migration of Flow > Target > Data Stream relationships.
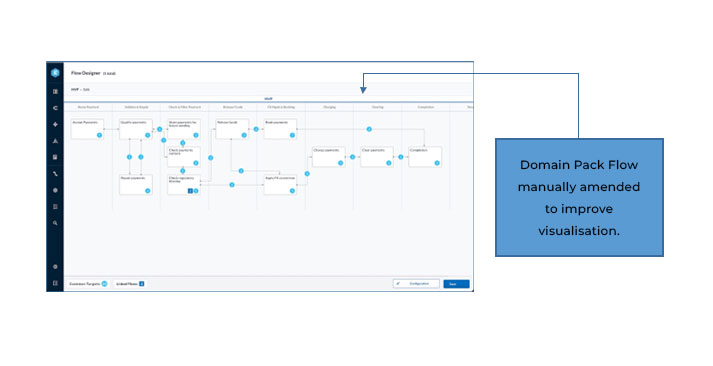
The Flow Designer (Flow Editor) tool within iControl has been completely rewritten to allow the user more flexibility in the positioning of both Steps and Links, allowing for the user to define the actual position of each step (allowing for gaps) as well as defining the position and order of links between steps.
I think we can all agree this allows for the production of much better-looking Flows as can be seen in the example below.
- BACKEND-2271 removing dimension values leaves aggregated Target orphans.
- BACKEND-2618 saving common dashboard changes in the user dashboard page.
- BACKEND-2768 undecided cut-off counts being displayed when ignored.
- BACKEND-2810 custom role not visible in iControl Splunk cloud.
- BACKEND-2905 data integrity issue breaks event processing.
- BACKEND-2932 Base Search mapping not being updated on Data Stream edit.
- BACKEND-2941 truncate checksums to match bitbucket reported checksums.
- BACKEND-2958 target mapping in Flows not reflected in associated GroupBy widgets.
- WEB-2918 page error should be cleared automatically when user changes page.
- WEB-3020 changing dimension value name not reflected in widgets until browser refresh.
- WEB-3524 back button missing within Target drill-down list to details forms.
- WEB-3545 incorrect form displayed creating custom Calendar within Create Target.
- WEB-3565 unable to access all entries in FilterBy long list on widgets.
- WEB-3572 Target Performance list FilterBy status ‘Not Breached’ not filtering.
- WEB-3579 unable to refresh Dimension Performance list statuses without browser refresh.
- WEB-3593 inactive (as well as draft) Targets should not be visible on Flow widget or page.
- WEB-3623 hover over multiple in widget header not displaying tooltip containing selected values.
- WEB-3681 observation widgets not rendering in dashboards even with valid monitoring data.
- WEB-3244 implementation of column sort order on Performance and List pages.
- WEB-3368 add external link access ‘icon’ to observation widget headers.
- WEB-3605 new ‘Reports’ menu item opens URL in settings within new tab.
DRYiCE iControl dependencies:
- Splunk Machine Learning Toolkit v5 (for Splunk 8 and above).
iControl is a product within the emerging market sector of Operations Intelligence – Technology solutions that leverage analytics to help end-users continuously observe and manage business operations in real time.
iControl forms part of a combined software and services solution developed by HCL DRYiCE around “Business Process Observability” which enables its customers to observe, measure, and report on the impact of IT performance in delivering business outcomes. Today iControl is primarily used by the project teams as an implementation tool.
Business Process Observability enables end users to observe business-relevant targets on a real-time basis and take informed actions accordingly. It is used by Operations technology staff on a day-to-day basis to ensure the smooth running of the critical business flows to deliver end product outcomes.
Key elements of a Business Process Observability implementation are to:
- Define a visual “flow” for the end-to-end business process.
- Define service-level targets to set expected performance for key points within the flow.
- Associate these targets with metric data provided from underlying monitoring.
- Calculate real-time service-level performance and capture variance from expected levels.
- For existing customer support log on to support.dryice.ai
- For sales-related inquiries, please reach us at support.dryice.ai@hcl.com