RELEASE DETAILS
| Product Name | DRYiCE iControl |
| Version Number | 2.5.0 |
| Release Month | August , 2023 |
| Release Size (KB/MB/GB) | 9.5 MB |
The iControl product provides business context to operational events by linking applications, business units, and products to a business process flow delivering products or services to an endpoint. It resolves the challenges with data sanity/accuracy to enhance the performance observability and add predictive analytics through machine learning and a growing list of dashboard widgets. The following document details changes within the release (version above). There are a number of new features in this release as documented below.
These release notes relate to version 2.5.0 improvements and updates, over 290 development tasks are included within the release. This release also updated the underlying 3rd party component libraries and fulfils corporate release compliance guidelines.
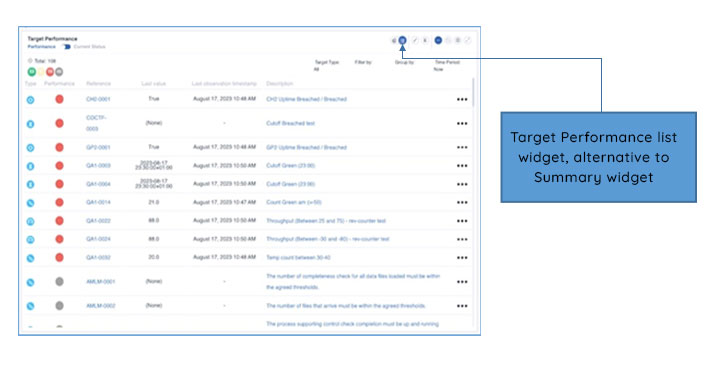
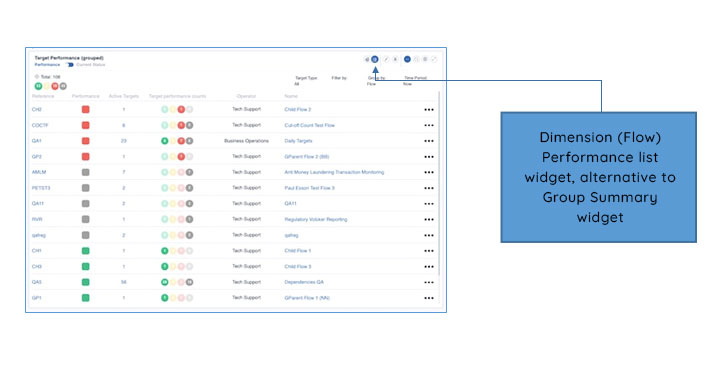
We have introduced two additional table (or list) widgets, one for Targets and another for Dimensions (Flow Performance can be listed Flow being a dimension).
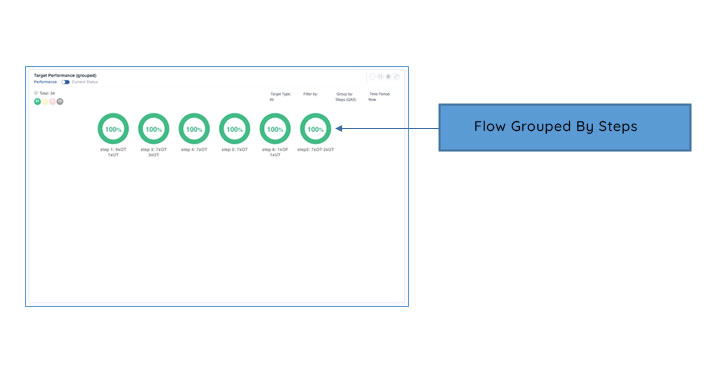
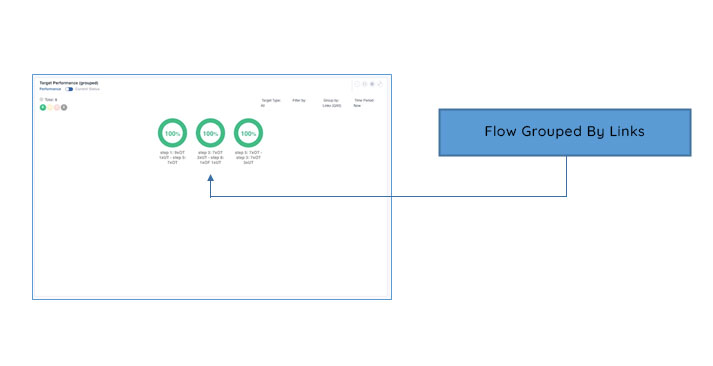
We have implemented system generated groups for Flow Lanes/Steps/Links to allow, for example, the display of status by specific stages within a Flow and represented within Group Summary Pie and List Widgets.
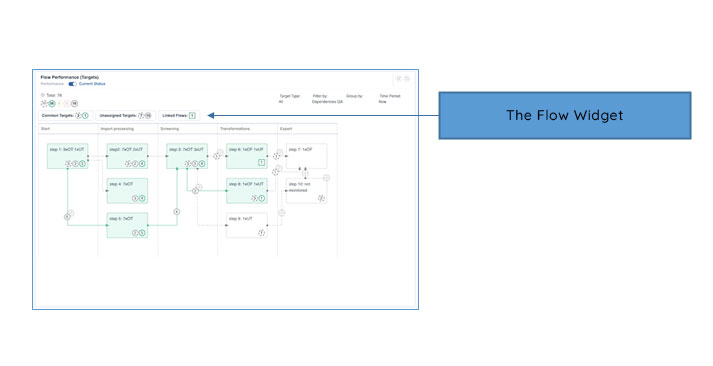
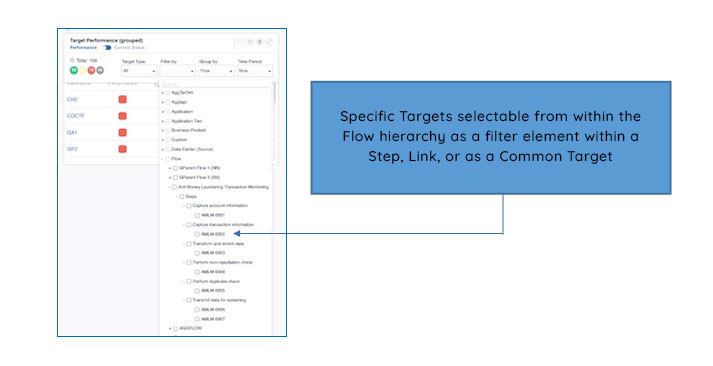
As well as the ability to Group by Flow components (Lanes, Steps and Links) we also now can filter by individual Targets within all widgets. For example, we can select specific Targets within the Filter By drop-down list.
The Flow Performance Widget has been replaced with an out-of-the-box implementation using the latest ‘react’ library, improving the look and operation of Flow diagrams as well as the user of different styles of Flow representation (columns, Swim lanes, functional blocks, etc.) which will be implemented in coming releases.
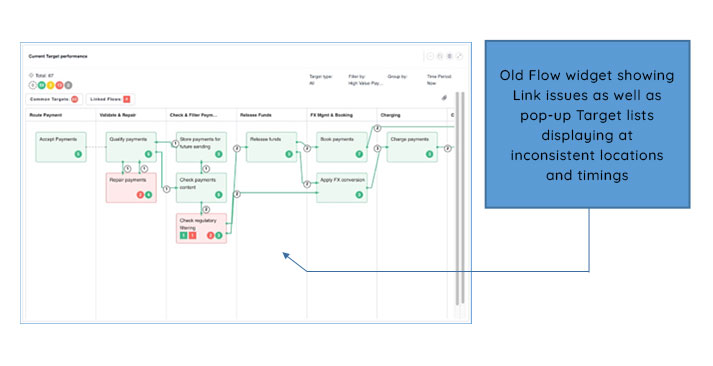
For an example of the immediate improvements here is a Flow using the ‘old’ Widget:
Here is the Same Flow displayed using the ‘new’ Widget:
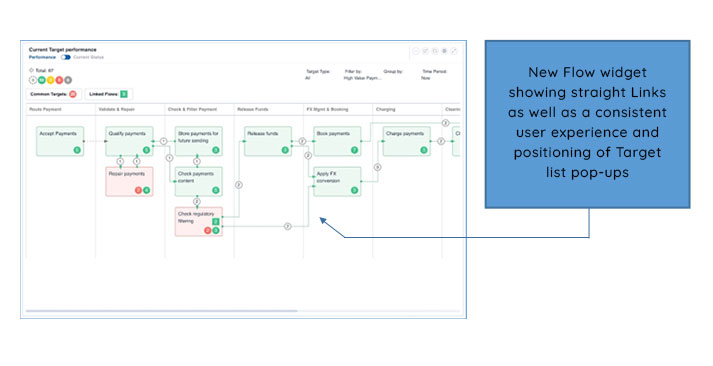
As can be seen the new Flow Widget is ‘sharper’ with straight ‘Links’ between steps. These two versions use the same Flow Designer file. Within the next release we will be replacing the Flow Designer within iControl with:
-
The ability to drag’n’drop Steps to the desired position.
-
The ability to leave gaps whereby the Steps are not ‘Top Justified’ but positioned optimally.
-
The ability to ‘tweak’ the positions of Links within having to delete and replace associated Targets.
-
The ability to add columns in any position within an existing flow including before or after the first/last column.
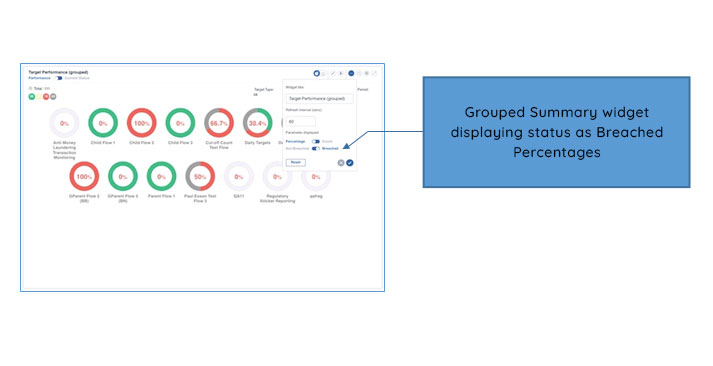
The ability to select the way in which status is displayed within Summary widgets:
-
As a count or a percentage.
-
Display of Breached or Not Breached values.
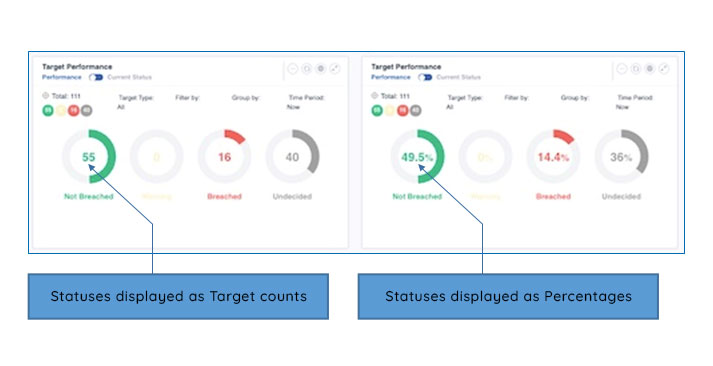
For the Group Summary widget user can select whether Breached or Not Breached value is displayed in the middle of the Pie chart, or whether Percentage or Count is displayed.

For the Summary widget the user can select whether count or percentage is displayed.
We have added the ability for Users with the Application Manager role to be able to Export or Import Flows within a formatted JSON file.
-
On Export, associated Targets will also be exported with the Flow.
-
On Import, if associated Targets exist within the JSON file they will also be imported.
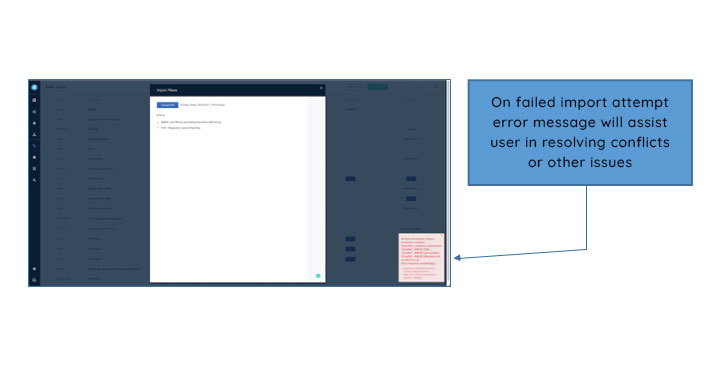
Associated Dimension values will be added to existing Dimensions within the destination system, if a Dimension does not the Import will not proceed, and the User will be informed of the changes required to the destination system to facilitate successful import.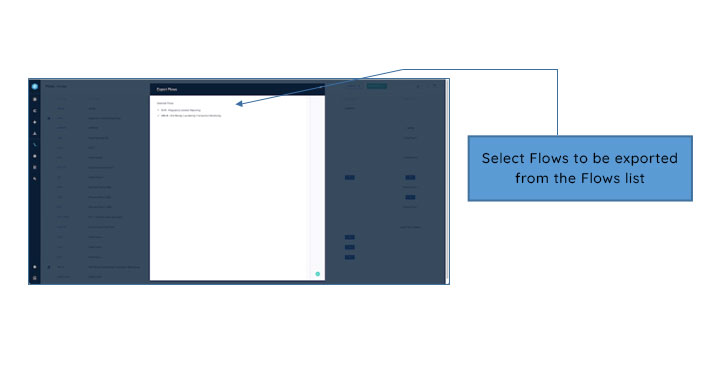
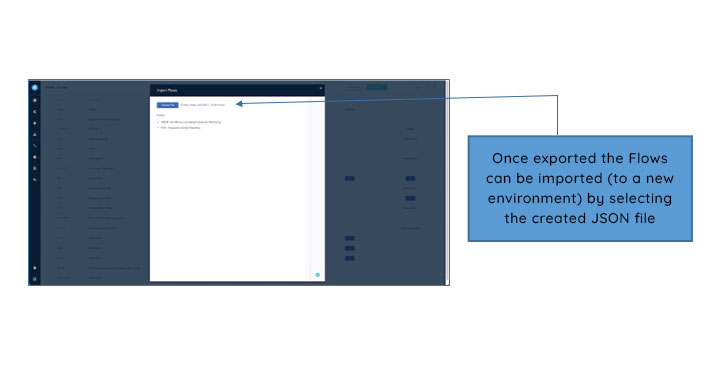
If any of the Flows within the import file already exist within the destination environment an error message will guide the user to the required issue resolution.
New Flows have been added (see table below) and a number of existing Domain Pack Flows have been updated and improved to better reflect standard best practices.
| Industry | Domain | Flow |
|---|---|---|
| Life Sciences | Clinical Trials | Clinical Trial Process |
| Retail and Consumer Packaged Goods (RCPG) | Store Operations | Coupon Code Update Process |
| Retail and Consumer Packaged Goods (RCPG) | Store Operations | Store Inventory Update Process |
| Manufacturing | Production Execution | Dispatching and Invoicing Process |
| Manufacturing | Production Execution | Material Receipt Process |
| Manufacturing | Production Execution | Dispensing and Material Consumption Process |
-
Carry forward user setting enabled for individual Uptime and Count Target types (multiple tickets).
-
Widget refresh only shows refresh icon as busy, widget stays visible and up to date (multiple tickets).
-
Added switch between Performance and Current Status views in Widget headers (WEB-3281).
-
Fixed – Dimension values: unable to remove the parentref from a parent (BACKEND-2260).
-
Fixed – Changing dimension value 'name' not being reflected in widgets (WEB-3020).
-
Resolved - Confirm all links, counts, popups, external links UX and visible within the frame (WEB-3300).
-
Fixed – Unable to create Inclusion/Exclusion days on a new Calendar until saved (WEB-3276).
-
Fixed – External Links on Flow Widget (steps) fixed on page, not staying with step on scroll (WEB-3277).
-
Resolved - Add Operator column back into Flow Performance list page (WEB-3302).
-
Fixed – Group Pie not displaying correctly when all Targets undecided/Excluded (WEB-3068).
-
Fixed – Incorrect validation on daily Target spanning two days (WEB-3156).
-
Fixed – Flow Performance title error when displaying details page (WEB-3136).
-
Fixed – Target Performance associated to multiple dimensions not appearing on Dimension Flow Widget (BACKEND-2386).
-
Resolved – On hovering over Filter By user should see full names or multiple names, even on Common dashboards (WEB-3197).
-
Fixed – Issue relating to the display of long name dashboards, maintaining ‘…’ (WEB-3235).
-
Resolved – Error messaging, automatically remove all errors when changing page (WEB-3174).
-
Fixed – Unable to add inclusion/exclusion days to a Calendar until it has been saved (WEB-3276).
-
Fixed – a user with associated permissions should still not be able to save updates to Shared or Common dashboards from the User dashboard page (WEB-3402).
-
Fixed – Creating a calendar for 24/7/365 operation still applied regional holidays even if not set (BACKEND-2608).
-
Fixed – Draft Targets are visible within the Flow Widget (WEB-3484).
-
Fixed – Enterprise Flow Widget/Uptime Performance counts not matching (BACKEND-2681).
-
Fixed – Flow Widget refreshes while using drill-down interrupts user root cause analysis (WEB-3265).
-
Fixed – Incorrect data displayed on Observation Widgets without observations (WEB-2557).
DRYiCE iControl dependencies:
-
Splunk Machine Learning Toolkit v5 (for Splunk 8 and above).
iControl is a product within the emerging market sector of Operations Intelligence – Technology solutions that leverage analytics to help end-users continuously observe and manage business operations in real-time.
iControl forms part of a combined software and services solution developed by HCL DRYiCE around “Business Process Observability” which enables its customers to observe, measure, and report on the impact of IT performance in delivering business outcomes. Today iControl is primarily used by the project teams as an implementation tool.
Business Process Observability enables end users to observe business relevant targets on a real-time basis and take informed actions accordingly. It is used by Operations technology staff on a day-to-day basis to ensure smooth running of the critical business flows to deliver end product outcomes.
Key elements of a Business Process Observability implementation are to:
-
Define a visual “flow” for the end-to-end business process
-
Define service-level targets to set expected performance for key points within the flow
-
Associate these targets with metric data provided from underlying monitoring
-
Calculate real-time service-level performance and capture variance from expected levels
-
For existing customer support log on to support.dryice.ai
-
For sales-related inquiries, please reach us at support.dryice.ai@hcl.com