RELEASE DETAILS
| Product Name | DRYiCE iControl |
| Version Number | 1.8 |
| Release Month | May , 2021 |
| Release Size (KB/MB/GB) | 9 MB |
The iControl product provides business context to operational events by linking applications, business units, and products to a business process flow delivering products or services to an endpoint. It resolves the challenges with data sanity/accuracy to enhance the performance observability and add predictive analytics through machine learning and a growing list of dashboard widgets. The following document details changes within the release (version above). There are a number of new features in this release as documented below.
Uptime Observation Widget
A new Uptime observation widget has been added to display the current (latest) status of an Uptime target.
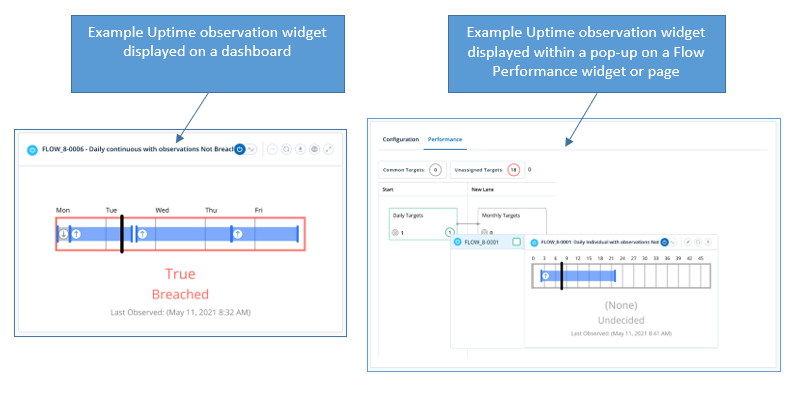
As with other observation widgets, the Uptime latest observation widget can be accessed via widget target drill-downs or via the Target Performance page. Once displayed it can also be ‘pinned’ to dashboards, if required.
Cut-off Observation Widget
A new Cut-off observation widget has been added to display the current (latest) status of a cut-off target.
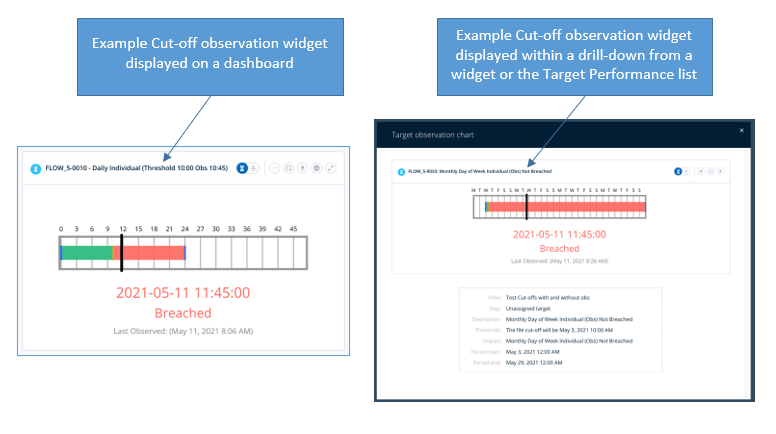
As with other observation widgets, the Cut-off latest observation widget can be accessed via widget target drill-downs or via the Target Performance page. Once displayed it can also be ‘pinned’ to dashboards, if required.
Flow Performance page drilldowns
Users can now access the flow performance ‘widget’ visualisation directly via both the Flow Performance page and also via the Flows list page.
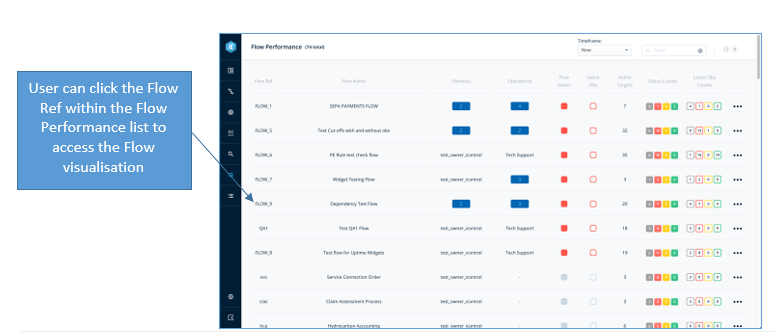
User clicks any Flow Ref to display the associated Flow Performance visualisation.
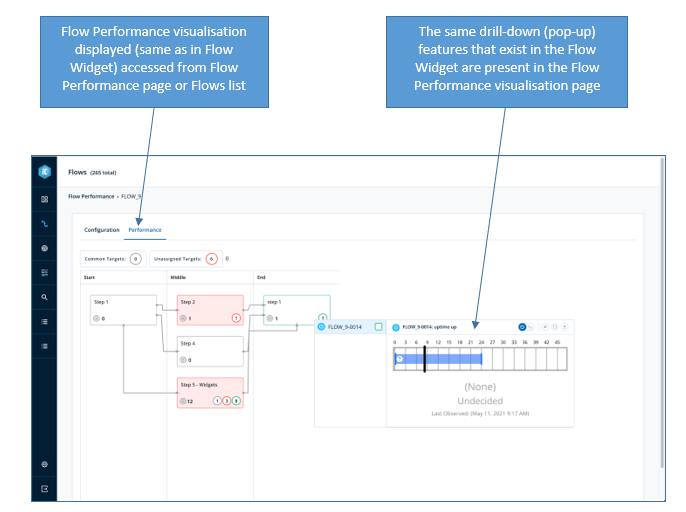
The Flow Performance page contains breadcrumbs to allow the user to simply switch between viewing visualisations for multiple Flows.
The page is tabbed and contains access to both the configuration page and the flow visualisation page:
- Configuration page – previous called the view details page. This page allows an admin or operator access to edit the flow details and visualisation within the Flow Designer page.
- Performance – This is the flow visualisation page as already exists within the Flow Widget, from which the user can access all associated target performance details, target drill-downs, and target observation history graphs.
As previously mentioned, the page can be accessed from either the Flows list page (which will default to the configurations tab) or from the Flow Performance list page (which defaults to the Performance tab).
Observations by Date Range/Latest Breach Window
Users can now access Observations within a target drill-down by date range. Via the ‘…’ menu the user can select any Target to display the list of associated observation windows for the current selected historic period.
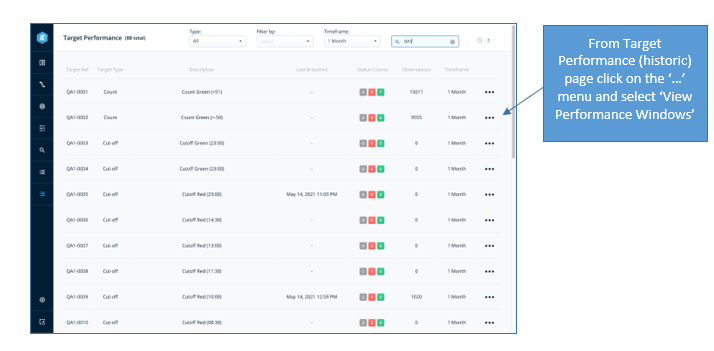
The selected Target history is displayed as a list of active periods covering the historical period selected (in the displayed example covering the previous weeks activity).
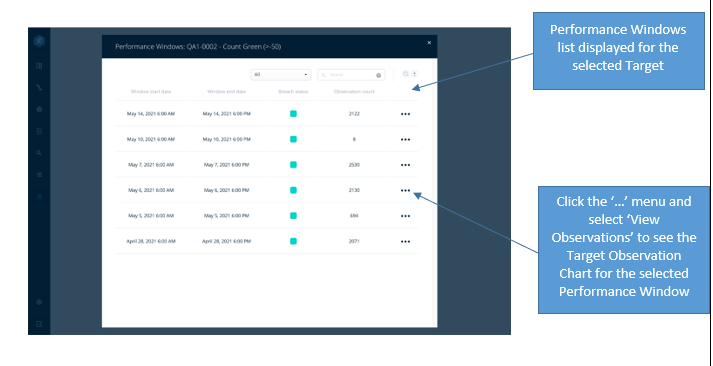
On clicking the ‘…’menu and selecting to View Observations for, as an example, the 6th May will display the associated Target Observation Chart for the selected period.
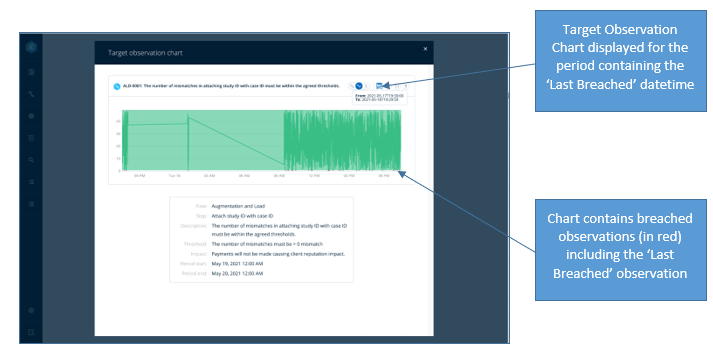
As part of the observations window feature release, we have also added the facility to directly access the ‘Last Breached’ observations window via the Target Performance historic list page. In the screenshot below, you can see the targets within the list that have previously breached within the selected timeframe.
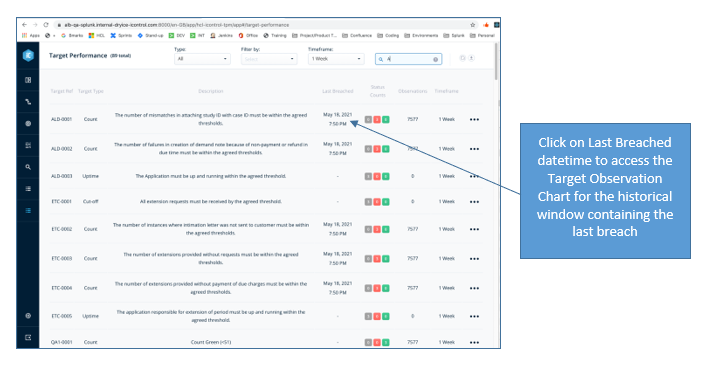
Clicking on the ‘Last Breached’ datetime for a target with historical breach within the current selected timeframe will access the observation window containing the associated breach.
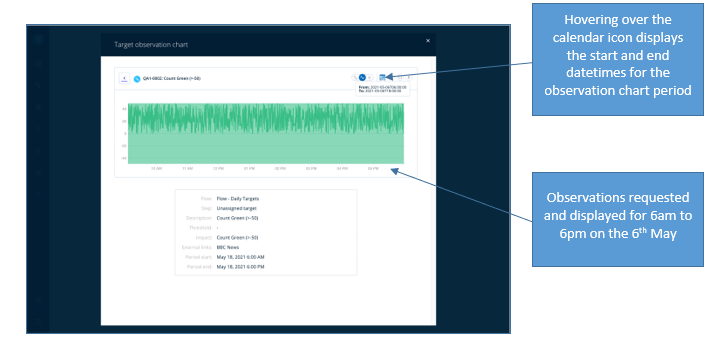
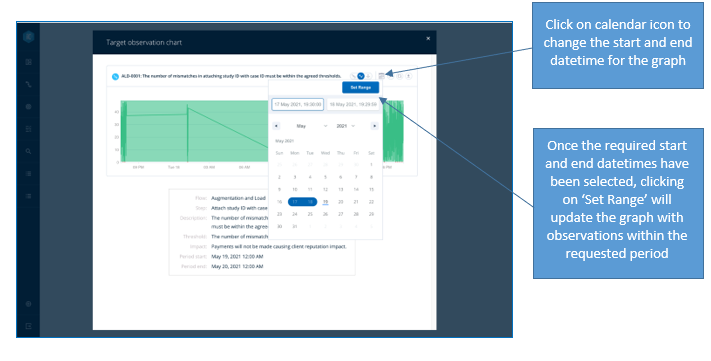
Once the user has accessed any value or deviation observation graph, whether via Target Performance history or any other ‘drill-down’ route, they can select any observation datetime range to display by clicking on the calendar icon in the widget header.
Flow Widget external Links
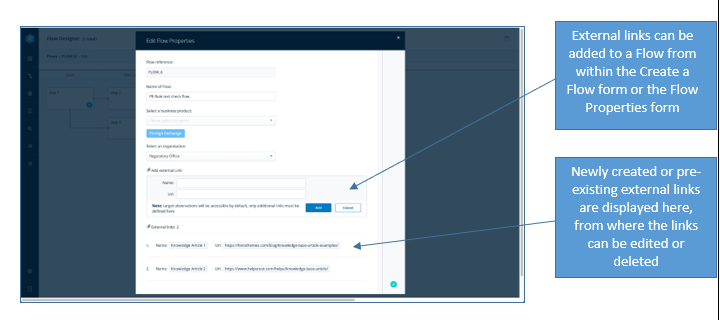
In addition to the existing Target external links, users can now configure and access external links to systems or knowledge articles directly from the Flow widget and Flow Performance pages.
The external links can be configured within the Create a Flow form, or once a flow has been created - via the Flow Properties form (accessed from within the Flow Designer page).
As previously stated, once added the external links can be accessed via the ‘Link’ icon that appears at the top right of the Flow Performance page or the Flow widgets.
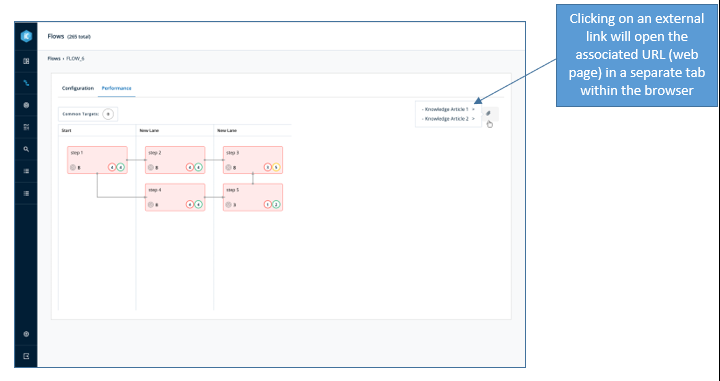
Note: If a flow does not have any external links the ‘Link’ icon will not be displayed.
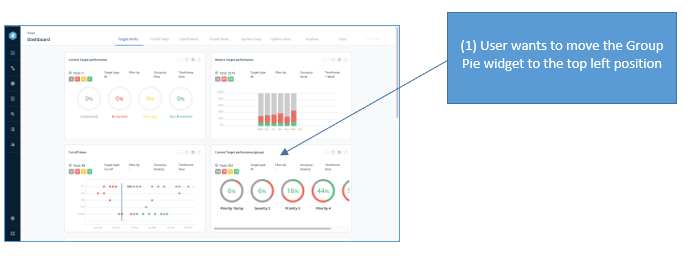
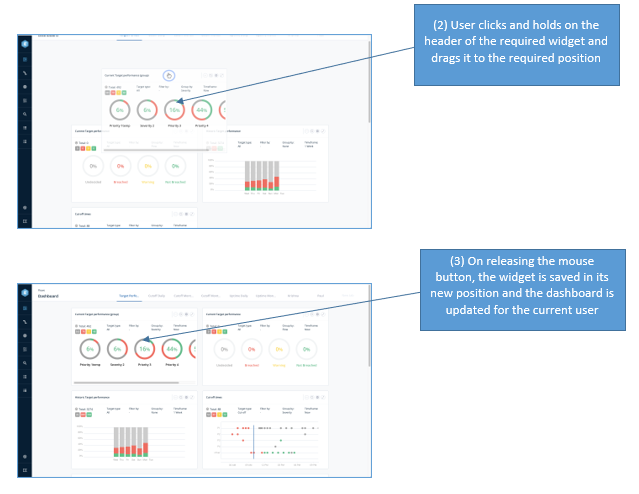
Re-order Dashboard Widgets
Users can now re-order widgets on their dashboards using ‘Drag’n’Drop’ with their computer mouse.
As part of the next release, users will be able to move widgets across dashboards as well as within a dashboard.
In total there were 225 JIRA tickets completed including enhancements, improvements, new fixes, and features added as part of this release. Below are the key highlights.
- Numerous speed improvements including optimising list pages queries.
- In association to the speed improvement changes we have also ensured that the latest copy of an object is read before being presented for editing or review.
- Added Owner column to the textual search within the targets list.
- Increased the number of dashboards for each user from six to ten.
- Changed the target tooltips displayed on widgets, removed the ‘#’ as misleading indicates count rather than number.
- Added enhancement to allow for continued generate of predictions even after a target has breached.
- Changed breachStatus = Undecided to a specific value rather than leaving it as null, which can be present in the case of an error and therefore can result in misleading results.
- Improved diagnostics added the condition whereby if the structured error message received from the backend is blank, then the whole message is displayed on screen bottom right corner pop-up. This is to ensure that we do not have errors which display a blank message and therefore cannot be assessed.
- Relabelled ‘External Link’ references for consistency across the application and user interface.
- Performance improvement: Removed call for complete target list when accessing the flow designer page, only calls the target list for the required flow.
- Added call to ensure view details page always displaying up to date Data Stream information.
- Restructured the flow details page into tabs to allow for access to the flow configuration (details) as well as the flow performance (widget) from one place.
- Added the ability to define a separate field summary window compared to the resulting base search query window. On creating or editing a base search this allows for a wide timeframe query to identify the available base search fields for events that occur on an irregular basis.
- Amended colours on latest observation widgets statuses to align with the existing breach status colours.
- Amended the display of target counts and statuses within the flow widget and page to always display the status and target counts.
- Added a breadcrumb to the Flow Designer page to allow for easy exit back to the Flows list page.
- Amended the Target Performance page so that clicking on the target reference would access the target drill-down (and not the target details page).
- Addressed target performance queue errors being generated on end-of-day and start-of-day transitions.
- Added lifecycle errors info to the iControl (Splunk) dashboards.
- Improved the screen layout and order of controls in the calendar rollout form.
- Performance improvement: Amended the target list endpoint to remove roles from the page.
- Performance improvement: Amended data stream list endpoint to remove dimensions.
- Performance improvement: Separated calls for latest target status and observation endpoint details so that only the data required for observation graphs is called when a graph is displayed.
- Added dependency and predictive warnings as well as impact details to the target drill-down form.
- Performance improvement: Amended existing Throughput, Count, and Duration latest observation widgets to use target table now details for latest status instead of using the observation endpoint.
- Performance improvement: Amended the Base Search list page call to remove ‘fields’ from the list page.
- Cut-off Swimlanes Widget – improved display of ‘no active’ targets, removed on-widget message.
- Group Pie Chart Widget – improved display of ‘no active’ targets, removed on-widget message.
- Added additional data tag id’s to on-screen elements to facilitate additional automated testing.
- Updated the iControl copyright notice for 2021.
- Added updated Domain Packs.
- Fixed issue where owner is not displayed in targets list, if not received in endpoint as first entry.
- Fixed bug where able to set a threshold of ‘-0’ forces user to enter ‘0’ or a real negative number.
- Fixed issue where user unable to close Create Target form if using a low-resolution screen.
- Fixed issue where certain paths through the application resulted in an incorrect call for Flow Performance page lists.
- ‘Not Breached’ statuses, corrected labels on lists and widgets.
- Fixed issue where time zones and regional holidays were missing from calendar holiday lists.
- Fixed validation issue whereby if message “No active months selected’ was displayed, user was unable to correct issue without closing the create form.
- Fixed issue where unable to link specific users and groups resulted in the failing of Create Target owner list and breaking of user details page.
- Fixed issue where if user does a browser refresh when the edit target form is displayed, the form loses all details and displays an empty edit form.
- Pre-existing dashboard 'Observation' widgets returning 'targetType = null' (SPLUNK-1446).
- Fixed regression issue on Users API no longer conforming to schema.
- Selecting multiple industries in the Domain Packs filter only returns the first/single industry to the front-end for selection. So currently only able to have all or a single industry (SPLUNK-1445).
- Fixed the issue whereby if there is an error when attempting to add a widget to a dashboard the add widget button would stop working until the application was restarted.
- When creating a Flow from a Domain Pack with Targets, system was not checking Target creation permissions prior to creating the flow. So, if the user was not the Owner or an Operating Group member for the Domain Pack Targets, the Flow would be created without targets.
- Fixed issue where SPL execution errors from machine learning were not being propagated. So, if machine learning (predictive) model was not created by the toolkit, error was not exposed to the user to retry model creation.
- Fixed issue where predictive models were not being re-created with up-to-date data under certain circumstances.
- Fixed issue whereby cut-off targets were not displaying the nth to last day thresholds on target create/edit visualisations and widgets.
- Fixed an issue whereby ‘long’ flow/target references were causing the display of pop-up target lists to corrupt the display by wrapping the details, list widened to accommodate up to 15 characters.
- Fixed issue where an empty drill-down target list would display an error, having an empty list is a valid state and list amended to display ‘no data’ same as list pages.
- Fixed issue where multiple Domain Pack industries selected in settings page but only the first industry was being returned into the frontend for user selection.
- Resolved: As a consequence of performance improvement changes, the data stream list would break if accessed after displaying a target details page.
- Fixed issue where user was able to save a monthly target where the start time was after the end time on the same day.
- Investigated and resolved issues with non-standard port selection on Splunk.
- Fixed an error whereby a target with a valid lifecycle that after opening for target performance calculation is then changed to create an invalid lifecycle caused the target performance processing to break.
- Fixed issues whereby the target status sort order was different between the target performance list, the pop-up lists and the target drill-down lists.
- Fixed the User Admin ‘Roles’ page, which could be broken by accessing via a specific route.
- Fixed issue where first breach date was not being set for a previously healthy target on target breach.
- Fixed an issue where the Data Stream view details page would break if accessed via a specific route.
- Fixed legacy issue whereby some very old observation widgets ‘pinned’ to dashboards were returning an undefined target type, correct target types added and saved to dashboards.
- Fixed an issue where Net Breach Status could be incorrectly set and shown as breached when not breached.
- Fixed issue where a User deleted (instead of disabled) from LDAP would break the user admin page, deleted user is displayed with the unknown name/username set to a dash ‘-‘.
- Fixed legacy issue where target calls for Unassigned and Common target counts were returning incorrect results for display on the flow widget header.
- Addressed an issue with session object raised during Splunk Cloud vetting.
- Fixed issue where first breach and last breach dates were not being set for targets without observations.
- Fixed issue where unable to carry forward Uptime Targets without an active threshold at end-of-day, so targets that closed earlier than midnight would not carry forward.
DRYiCE iControl dependencies:
- Splunk Machine Learning Toolkit v5 (for Splunk 8 and above)
iControl is a product within the emerging market sector of Operations Intelligence – Technology solutions that leverage analytics to help end-users continuously observe and manage business operations in real-time.
iControl forms part of a combined software and services solution developed by HCL DRYiCE around “Business Process Observability” which enables its customers to observe, measure, and report on the impact of IT performance in delivering business outcomes. Today iControl is primarily used by the project teams as an implementation tool.
Business Process Observability enables end users to observe business relevant targets on a real-time basis and take informed actions accordingly. It is used by Operations technology staff on a day-to-day basis to ensure smooth running of the critical business flows to deliver end product outcomes.
Key elements of a Business Process Observability implementation are to:
- Define a visual “flow” for the end-to-end business process
- Define service-level targets to set expected performance for key points within the flow
- Associate these targets with metric data provided from underlying monitoring
- Calculate real-time service-level performance and capture variance from expected levels
For sales-related inquiries, please reach us at support.dryice.ai@hcl.com