RELEASE DETAILS
| Product Name | DRYiCE iControl |
| Version Number | 2.2 |
| Release Month | June , 2022 |
| Release Size (KB/MB/GB) | 9 MB |
The iControl product provides business context to operational events by linking applications, business units, and products to a business process flow delivering products or services to an endpoint. It resolves the challenges with data sanity/accuracy to enhance the performance observability and add predictive analytics through machine learning and a growing list of dashboard widgets. The following document details changes within the release (version above). There are a number of new features in this release as documented below.
These release notes relate to version 2.2.0 which had over 330 development tasks included within the release.

- The Service Tree widget displays hierarchical weighted performance.
- Includes all associated dimensions values which have an aggregated target assigned.
- The Service Tree displayed is based on the selected value, displaying its children and ancestors.

- All flows which are associated to the one displayed will be listed as either a parent or a child flow.
- Clicking on any of the parent or child flows within the pop-up will display the selected flow.
- The pop-up shows the current status for all the parents and children flows.
- The pop-up is also displayed within the flow designer page, though without known status.

- The Calendar widget displays either summary or grouped historical performance data.
- Time period can be set to either 1 Week or 1 Month.
- Click on any of the status indicators to access historic target drilldowns.

- Two dashboard types can be created, Default dashboards (issued to a user on first login) which become ‘owned/editable’ by the user, and Common dashboards (assigned to users/groups) which are always presented as the latest version but is not editable by the user.
- Shared Dashboard admin via the settings menu.
- Users can create edit dashboards directly via the button or by clicking on an existing dashboard.

- Common dashboards have an Owner group, whose members maintain the dashboard.
- Default dashboards do not have an Owner group, they are maintained by App Managers.

- The Dimension list is accessed via the Settings menu.
- Existing dimensions or dimension values can be added, edited or deleted via dimension admin.
- Dimension can be set as captured within a Flow, within a Data Stream or within a Target (as a Target Definition dimension or as a Target Impact dimension), but all dimensions ultimately relate to targets, applied either as Filters or Groups for reporting purposes.
- Dimensions can be created or edited through the form below, the order within the destination form can also be defined by the user.

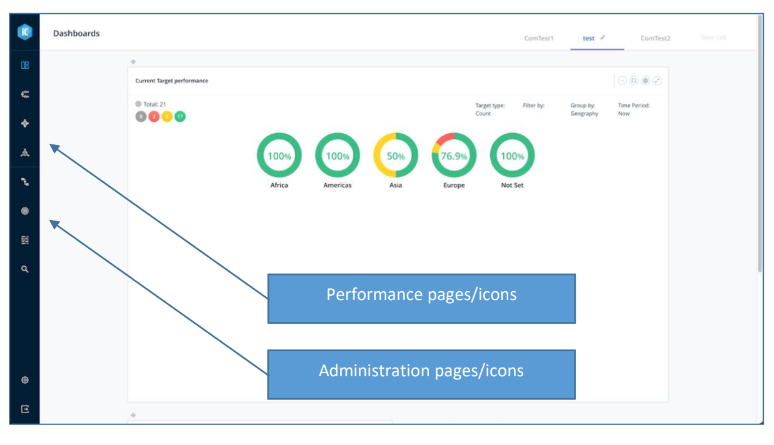
- Main Menu – New icons and order whereby the operational (performance monitoring pages) are grouped at the top of the menu and the object administration (create and edit) screens are accessed via the bottom of the menu.
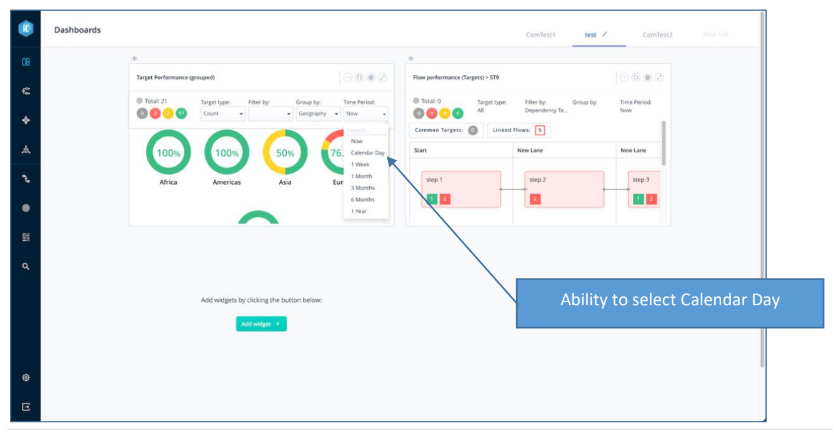
- Calendar day – the ability to select Calendar Day (rather than ‘Now’) with the performance time periods list. Whereas ‘Now’ displays results for the associated Targets that are currently active/open ‘Calendar Day’ displays results for all targets that are currently active/open PLUS Targets that were previously active/open within the current time zone day.
- Widget Constraints – Rewritten widget constraints to offer widget types, including aggregated and regular types, correctly and in the preferred order.
- Implemented ‘health check’ on login, will not allow user to load iControl until updated version patches and updates have been completed.
- Addition of a new ‘Target Viewer’ role whereby a Group (and all its members) can be given access to view the performance of a Target without the ability to edit the Target.
- Domain Pack selection drop-down lists arranged in alphabetical order to simplify location/identification of the required process.
- Add widget configuration of refresh rate and title to each dashboard widget (WEB-2209).
- Replaced Target Performance page ‘Filter by’ with Tree View for ease of use (WEB-2311).
- Created a new health endpoint to confirm iControl is ready on user login, ensures that after an upgrade any/all ‘patches’ have completed before user interaction (SPLUNK-1734).
- Use the login health check to run version migrator if it hasn’t run/started already (SPLUNK-1972).
- Improved error handling and details displayed within cut’n’paste messaging.
- Fix to display associated Data Streams on the Base Search details page (WEB-2767).
- Improve positioning of Flow performance pop-ups (WEB-2765).
- Amendments to the configurations to prioritise focused widgets over summary widgets (SPLUNK-2048).
- Re-write constraints processor to offer correct widget types for groups and filters selected (WEB-2553).
- Fixes to allow owners/operators to view Target/Flow performance data (SPLUNK-2063).
- Fix to remove inactive Uptime Targets from performance details (SPLUNK-1715).
- Fix groupings issue in optional dimensions (SPLUNK-1790).
- Remove ability to create a domain pack flow from within the create Target form (WEB-2704).
- Enable proxy role registration for cloud implementations (SPLUNK-1987).
- New macro created to derive Calendar Day within historical data (SPLUNK-2017).
- Support the new ‘Calendar Day’ new time period within widgets (SPLUNK-1864).
- Fix to return a single dimension entry for Targets where weight set (SPLUNK-1973).
- Fix to include hasChildren flag for Flow dimension (SPLUNK-1994).
- Fix to correct configuration and processing of Comparison Targets (SPLUNK-2016).
- Fix to allow for ‘same name’ dimensions to work within the same instance (WEB-2771).
- Fix to allow for an empty Base Search list (WEB-2778).
- Removed the time component from summary historical widgets ((SPLUNK-2052).
- Fix to remove unsupported widget being displayed when no widgets available for the selected
groups/filters (WEB-2783). - Increased stability of Flow widget pop-ups (WEB-2612).
- Fix to list dimensions and values alphabetically in Tree View (WEB-2593).
- Fix to allow Target with Leaf only hierarchical dimension to save (WEB-2597).
- Enabled query by timeframe for historical grouped queries (SPLUNK-1939).
- Dimension value permissions added security based on user capabilities (WEB-1119).
- Removed the validation that did not let user add the same dimension value reference to different dimensions (SPLUNK-1754).
- Enforced dimension value uniqueness within the same dimension (SPLUNK-1546).
- Fix to stop adding Target warnings to the Target performance index (SPLUNK-2007).
- Fix to ensure dimension list is refreshed when adding new values (WEB-2604).
- Fix to ensure a breached child Flow is setting the associated parent Flow step to breached (WEB-2630).
- Fix to display/configure cut-off and uptime observation widgets correctly in all time zones (WEB-2534).
- Improve validation when creating cut-off Target active periods (WEB-1087).
- Removal of Splunk Event Types from Data Streams (leaving Base Searches as the monitoring connection tool for Splunk (WEB-2594).
- Change SEV from legacy endpoint to use new dimension endpoint (WEB-1723).
- Handle errors directly thrown by Splunk Appserver (WEB-2346).
- Better handle errors on application load (WEB-1929).
- Apply sort order to domain pack drop-down lists (WEB-1816).
- Remove expand from endpoint in view details page, performance improvement (WEB-2308).
- Updated Flows list page to include parent flow details (WEB-1942).
- Fix to remove Breached status in performance page if Child Flow is Amber status (WEB-2672).
- Removed hard coding of India time zone (WEB-2420).
- Listed thresholds in chronological order in Target create/edit form (WEB-2589).
- Fix validation of custom dimensions in Flow edit form (SPLUNK-1804).
- Fixed Monthly Continuous Business Day Target causing lifecycle processor failure (SPLUNK-1839).
- Fixed Target create/edit form would freeze after failed validation (WEB-2542).
- Fixed external link issue where added links not displayed in Flow Widget (WEB-2549).
- Fixed Cancel button display/UX issue in Flow Properties form (WEB-2550).
- Fixed issue where deleting a dimension breaks the dimension list page until refreshed (WEB-2580).
- Performance improvements in Flow widget pop-up, reduced endpoint calls (WEB-2584).
- Fixed issue where pre-selected dimension values not being displayed for selected domain pack flow (WEB-2586).
- Fixed handling so that errors displayed as errors and warnings displayed as warnings (WEB-2592).
- Fixed ability to create aggregated Targets with mandatory weighted dimensions (WEB-2596).
- Added ‘Linked Flows’ details to Flow Widget and performance page (WEB-2605).
- Fixed search box on user admin pages to allow for multiple characters (WEB-2722).
- Performance improvement, only read the targets required to display flow performance (WEB-2611).
- Fixed issue within missing last observations (WEB-2690).
- Fixed issue with target drilldowns not filtering by status (SPLUNK-2006).
- Fixed issue with Parent/Child dimension value flags not being set/reset correctly (SPLUNK-1805).
- Fixed issue with incorrect status details being displayed on the Flow widget pop-ups (WEB-2635).
- Fixed issue with saving external links in flows (WEB-2647).
- Fixed issue with the Operator not being displayed on the Flow details page (WEB-2659).
- Fixed issue with widget refreshing on Flow widget pop-ups (WEB-2663).
- Fixed issue with Dimension list page braking if there are no Dimensions loaded (WEB-2677).
- Fixed issue where historical endpoints sending double values with different timestamps as a consequence of the clocks changing time zone between winter and summer (SPLUNK-1957).
- Fixed issue where full screen dashboard displayed blank when no dashboards in profile (WEB-2710).
- Implemented drag’n’drop dashboards with limitation around reordering of ‘Common’ dashboards that are not owned (or editable) by the user logged in.
- Fixed issue with Flow widget pop-ups not closing if exit from icon/count (WEB-2747).
- Removed the ‘system’ user from the iControl user list page (SPLUNK-2019).
- Fixed cut-off and uptime daily individual observation widgets not being displayed correctly across all time zones if the active period wraps of the start/end of the timeline (WEB-2757).
- Fixed issue whereby owners/operators were unable to access the settings menu (WEB-2781).
- Fixed issue whereby Target Performance page would freeze if no active Targets to display (WEB-2777).
- Fixed issue where Target Performance incorrectly displayed for multi-select dimensions (SPLUNK-2053).
- Updated numerous list heading and form field labels to improve consistency of naming conventions.
- Many other small changes, fixes and performance improvements.
DRYiCE iControl dependencies:
- Splunk Machine Learning Toolkit v5 (for Splunk 8 and above).
iControl is a product within the emerging market sector of Operations Intelligence – Technology solutions that leverage analytics to help end-users continuously observe and manage business operations in real-time.
iControl forms part of a combined software and services solution developed by HCL DRYiCE around “Business Flow Observability” which enables its customers to observe, measure, and report on the impact of IT performance in delivering business outcomes. Today iControl is primarily used by the project teams as an implementation tool.
Business Flow Observability enables end users to observe business relevant targets on a real-time basis and take informed actions accordingly. It is used by Operations technology staff on a day-to-day basis to ensure smooth running of the critical business flows to deliver end product outcomes.
Key elements of a Business Flow Observability implementation are to:
- Define a visual “flow” for the end-to-end business process
- Define service-level targets to set expected performance for key points within the flow
- Associate these targets with metric data provided from underlying monitoring
- Calculate real-time service-level performance and capture variance from expected levels
- For existing customer support log on to support.dryice.ai
- For sales-related inquiries, please reach us at support.dryice.ai@hcl.com