RELEASE DETAILS
| Product Name | DRYiCE iControl |
| Version Number | 2.0 |
| Release Month | November , 2021 |
| Release Period (if release was phased) | Interim release – 22ND Nov 2021 |
| Release Size (KB/MB/GB) | 9 MB |
The iControl product provides business context to operational events by linking applications, business units, and products to a business process flow delivering products or services to an endpoint. It resolves the challenges with data sanity/accuracy to enhance the performance observability and add predictive analytics through machine learning and a growing list of dashboard widgets. The following document details changes within the release (version above). There are a number of new features in this release as documented below.
These release notes relate to version 2.0 but include the release notes for interim version 1.9 which was not deployed externally but contained new features and fixes for implementation within the local demo environment.
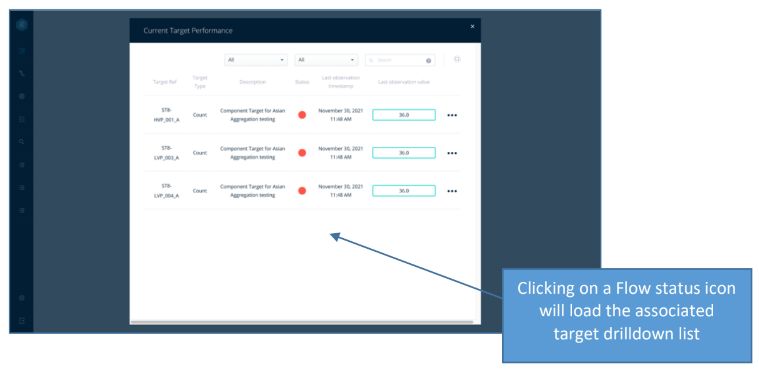
We have added last observation versions of the Target Performance summary widget and the Target Performance (grouped) summary widget. These widgets represent current status rather than Target Performance during the current active period.

These new widgets show the real-time status of associated targets, often targets that have breached during the current active period are then fixed or resolved so it is normal to see a higher ‘Breached’ count reported during the current active period and a higher ‘Not Breached’ count reported as the current status.
A new feature that can be applied to hierarchical dimensions such as Geography where, for example:
- A user can group targets by Geography to see consolidated performance for Asia, Africa, Europe, etc.
- The user can click Europe and see consolidated performance for Northern Europe, Western Europe, etc.
- The user can click Western Europe and see consolidated performance for France, Germany, etc.
- The user can click Germany (which has no further sub-regions defined) to access the detailed target
performance for the specific country.

The hierarchical drill-down will work with any dimension that has a parent-child-grandchild (hierarchical) type structure irrespective of where within the hierarchy targets are assigned. It will also allow for mixed hierarchical and flat dimensions where:
- Some values displayed in the GroupBy widget have ‘children’, so clicking will drilldown to the next level within the hierarchy.
- Some values displayed in the GroupBy widget do not have ‘children’, so clicking will display the target list associated to the dimension value.
As an additional benefit of implementing hierarchical (GroupBy) widgets, users can now group by dimension ‘values’ and not just by the dimensions themselves. So, for example, you can have a dashboard widget grouped by a region (e.g.: Northern Europe) and not just by Continent, at branch or leaf level not just at root level within the hierarchy.

Also, once the GroupBy value has been selected the widget filter can be used to exclude values not required for monitoring purposes, so in the example above there may be countries within Northern Europe the user does not wish to monitor.

The new Enterprise Widget is designed to show a high level summary view of Flows grouped by two dimensions within an x-y grid, enabling users to display flow performance by, for example, regions and products, regions and applications, products and cost-centres, or any other logical division of responsibility or functionality within the users domain.
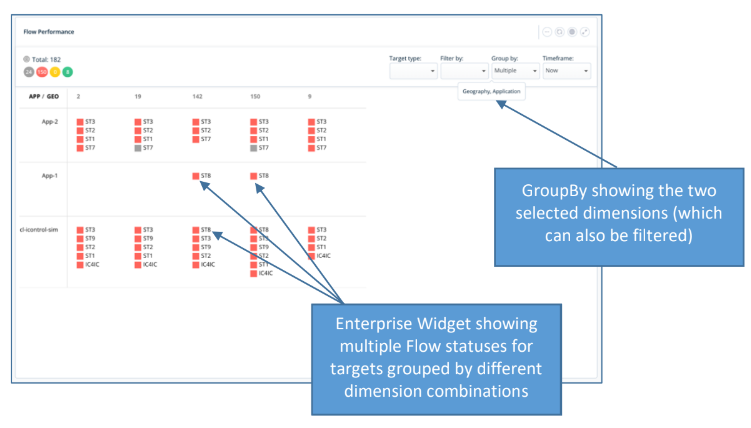
The Enterprise Widget will work with any dimension or parent value within a dimension, though the two selected dimension (values) must be from separate dimensions to computate a valid results summary.
There are two versions of the Widget, the Target Performance version displaying the status for the active period, and the Last Observation version displaying Current Status.
Aggregated targets are a new type of target introduced wiithin the 2.0 release and allow the user to specifically decide how ‘regular’ targets are aggregated and performance is measured within a reporting dimension.

Aggregated targets are created and updated through the normal Create/Edit Target form accessed from within the Target list. They can be created for any Dimension and any Values within the Dimension, though they are specifically useful for aggregation of targets associated to ‘weighted’ dimensions, where all targets are not equal.

The Aggregated Target ‘health scores’ can be viewed within the Weighted Dimension Performance page (covered next), within which ‘Greyed’ Dimension values indicate that Aggregated Targets have not been created for these specific Dimension values.
Once an Aggregated Target is selected and the Dimension ‘Connect target to:’ has been selected, the remaining decisions are:
- Is it a Daily or Monthly Target?
- What is the ‘Threshold’ to determine whether the Target has breached? Aggregated Targets have a score between 0 and 100, the threshold can be set within this range.

As previously mentioned, Aggregated Targets can be viewed within the Weighted Dimension Performance page, the Aggregated Target being listed in the right hand list and the associated Dimension value being listed within the left hand Dimension Performance list.

Please note: The weighted ‘score’ for an Aggregated Target is displayed against the Target, the same value is also displayed against the associated Dimension value (so Dimension value ‘India’ = the associated Aggregated Target Score = 100).
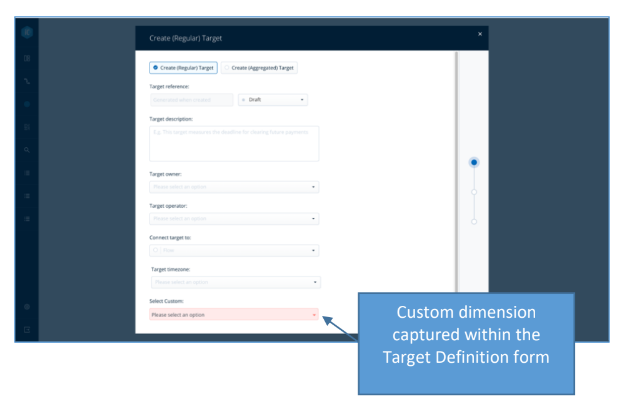
Once the associated dimension (Geography, Organisation, Application, etc) is configured as a ‘Weighted’ dimension, the weights will be captured when selecting the Dimension within the create Flow, Target or Data Stream forms, depending upon which object is to be associated to the Dimension value.
This ‘Weight‘ is then associated to the connected target and used within the calculation of ‘score’ for the Aggregate Target associated to a Dimension value, which can then be viewed within the Weighted Dimension Performance page.
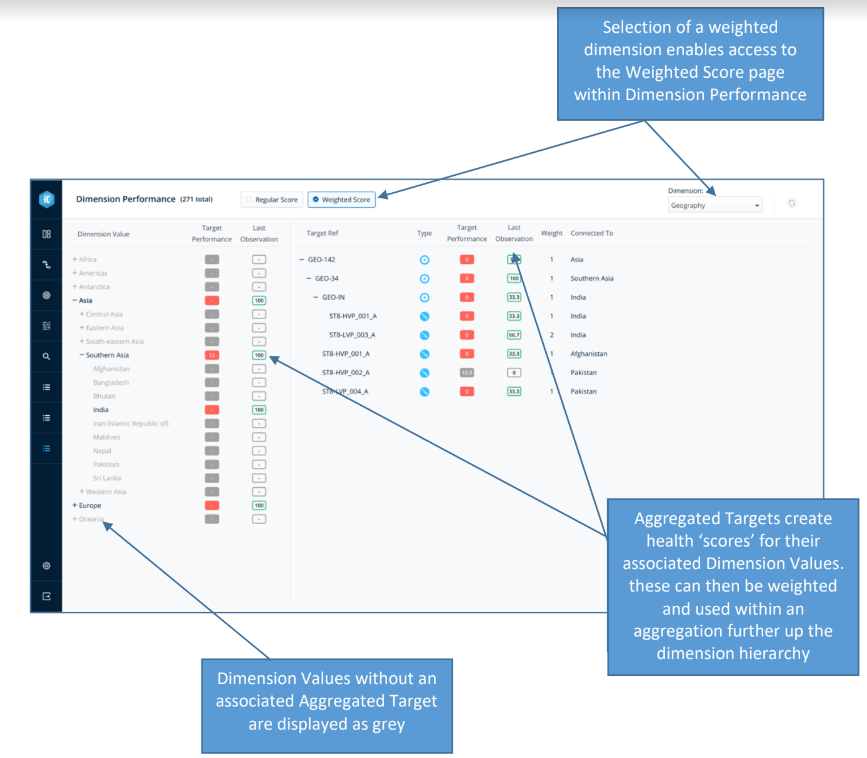
Dimension Values in the page list displayed in Black have an associated Aggregated Target. However, it is worth noting that this Dimension value can still have an undefined score ‘-‘ if it has no targets to aggregate.
Weighted Target Performance monitoring is very data driven, only by setting up the associations between Dimension Values and Aggregated Targets, and weighting the targets based on their criticality within the domain and the processes being monitored, we can reap the benefits of this powerful view of ‘How are we doing?’.
Following on from the previous feature section on Weighted Performance, the existing ‘out of the box’ dimensions (Organisations, Applications, Geography, etc.) can now be deleted or modified within iControl.
In addition, new dimensions can be added that are specific to the organisation or processes employing iControl. Also, dimensions can be tailored as ‘flat‘ or ‘tree’ structures to support, for example, an organisational structure or reporting hierarchy, and all dimensions can be setup as ‘Regular’ (allowing for simple Target status aggregation) or ‘Weighted’ (where different targets have different criticality or value within processes and flows).
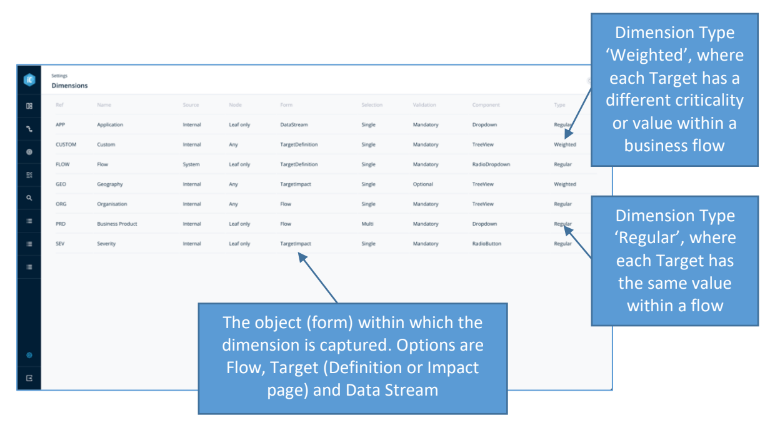
Please note: All dimensions are setup and associated to Targets, whether that is within the Target Create/Edit form directly or via the associated Flow or Data Stream Create/Edit forms.
- My Targets: Permission-based access to target lists, including the definition of ‘operating groups’ for Flows as well as the Targets.
- Persona-based Dashboards: The ability to configure default dashboards for specific roles or users within an implementation instance.
- Super viewer role: The addition of a new ‘C’ level role to allow viewer only access to all Flow/Target/Dimension Performance metrics.
- External Links: Ability to add an External Link to a specific Flow Step and Link (between Steps) as well as to the main flow. These links to external reference or operational systems can then be accessed via the Flow Widgets or the Flow Performance pages.
- Flow Operator: Added the ability to define the operating group within a flow. This then allows all members of the Group to see the Targets within the Flow even if they are not the Target Owner/Operator.
- Real-time Pie Widgets (Target Performance and Target Performance Grouped widgets) have been added to facilitate easier operational status monitoring on dashboards and are to be added to the default ‘Target Performance’ dashboard (CORE-389) as described above.
- Resolved – issue whereby observation widgets were intermittently rendering with corrupt data due to continuously re-requesting the details and creating too many searches (WEB-2033).
- Resolved – issue where dashboard drag and drop had disabled the ability to click and hold widget timelines and adjust left/right, and also the ability to scroll left/right on group bar charts (WEB 2036).
- Resolved – issue whereby due to the previous issue (WEB-2033) pop-up widgets would sometimes render the previous target details and not wait for the correct target details to be requested (WEB 2042).
- Resolved – issue whereby the new cut-off and uptime observation widgets would not display the ‘Not Breached’ status if active period started with a status of ‘Undecided’ (WEB-2044).
- Resolved – Whereby widgets would display Breach Status rather than the Last Breach Status (WEB-2066).
- Resolved – issue where count observation widgets with non-between rules were showing the value pointer in the wrong position (WEB-2067).
- Resolved – issue where some users had invalid dashboard details saved against their accounts and, due to further improvements and data modelling in release 1.8, these users dashboards were ignored and new dashboards created for them, losing all previously created and configured dashboards (SPLUNK-1620).
- Resolved – issue where the Base Search list was taking an excessive time to render, due to search validation being checked on the list request as well as the details request, removed the requirement to check validity of Base Searches when rendering the list (SPLUNK-1637).
- Resolved – Unable to correctly select/add regions (and holidays). This has been subsequently identified as an issue with edit only, not create (WEB-1740).
- Resolved – Filtered Target Performance list displaying an error if empty results (WEB-1798).
- Resolved – Target status counts displayed incorrectly within the Flow Performance list (SPLUNK-1447).
- Resolved – Observations outside Active Window generated incorrectly (SPLUNK-1536).
- Resolved – Better handle error on deleted target in observation widget, improved display on dashboard widget associated to a deleted target (WEB-1944).
- Resolved – There is an issue whereby a user may lose their dashboards on login if the dashboard previously configured had missing details. This issue did not appear in previous versions due to slacker validation and requires an upgrade patch to fix existing dashboards prior to user login (SPLUNK-1620).
- Resolved – ability to create a calendar within the Create Target form (WEB-2034).
- Resolved – Filtered Target Performance list displays an error if results empty (WEB-1798).
- Resolved - Unable to correctly select and add regions and holidays (WEB-1740).
- GroupBy widgets – now able to select Dimension Values as well as the core dimensions.
- Resolved – A number of improvements to widget visualisations (WEB-2205, WEB-2149, WEB-2150, etc.).
- Resolved – Unable to delete optional Dimensions Values (WEB-2439).
- Resolved – Flow Widget should only be offered when selecting Flow (dimension) values, not when selecting other dimension values (WEB-2431).
- Resolved – Incorrect totals displayed on Uptime Widgets (SPLUNK-1787).
- Resolved – Uptime availability calculation does not exclude scheduled downtime (SPLUNK-1679).
- Resolved – Amended FilterBy in dashboard widgets to OR values selected within a dimension AND values selected between dimensions (SPLUNK-1717).
DRYiCE iControl dependencies:
- Splunk Machine Learning Toolkit v5 (for Splunk 8 and above).
iControl is a product within the emerging market sector of Operations Intelligence – Technology solutions that leverage analytics to help end-users continuously observe and manage business operations in real-time.
iControl forms part of a combined software and services solution developed by HCL DRYiCE around “Business Flow Observability” which enables its customers to observe, measure, and report on the impact of IT performance in delivering business outcomes. Today iControl is primarily used by the project teams as an implementation tool.
Business Flow Observability enables end users to observe business relevant targets on a real-time basis and take informed actions accordingly. It is used by Operations technology staff on a day-to-day basis to ensure smooth running of the critical business flows to deliver end product outcomes.
Key elements of a Business Flow Observability implementation are to:
- Define a visual “flow” for the end-to-end business process
- Define service-level targets to set expected performance for key points within the flow
- Associate these targets with metric data provided from underlying monitoring
- Calculate real-time service-level performance and capture variance from expected levels
- For existing customer support log on to support.dryice.ai
- For sales-related inquiries, please reach us at support.dryice.ai@hcl.com