RELEASE DETAILS
| Product Name | DRYiCE iControl |
| Version Number | 1.5 |
| Release Month | September , 2020 |
| Release Size (KB/MB/GB) | 9 MB |
DRYiCE iControl (iControl) provides the business context to operational events by linking application, business units, and products to a business flow supporting delivery of a product or service to an endpoint. iControl resolves the challenges with data sanity/accuracy to enhance Target performance monitoring and add predictive real-time monitoring through Machine Learning and a growing list of dashboard widgets.
Flow Performance Page (current)
A new Flow Performance Page that lists all Flows and ‘current’ active target status, active period, and last observation status has been launched.
Count and status icons click through enabled to access existing target drill-down lists and target observation widgets
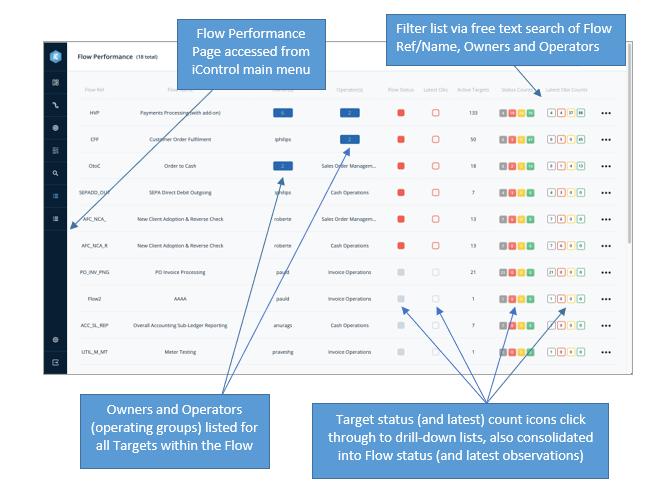
With the Flow Performance Page comes following built-in functionalities:
- Ability to `Filter By’ Flow Ref, Flow Name, Owners, and Operators using the textual filter
- Filters persist – moving away from the Target Performance page, or refreshing the page, preserves the previously selected filters during a single ‘logged in’ session
- Ability to manually refresh the list, with Last refresh time displayed in the refresh icon tooltip
- Target observations ‘pinned’ from the flow performance page are added to the default dashboard
In the next release the Flow Performance page will be extended to allow historical lists for timeframes 1 week, 1 month, 3 months, etc. Also, export Flow Performance list functionality will be added.
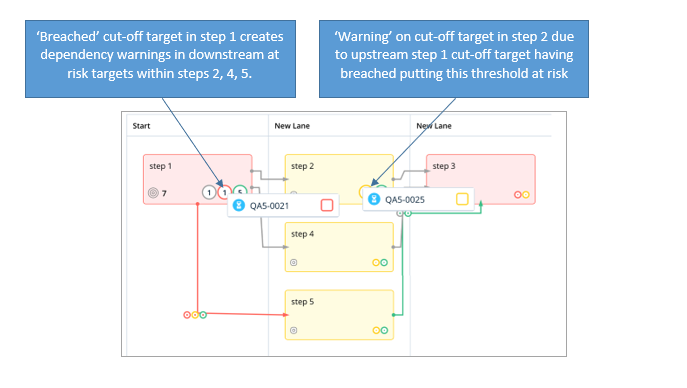
Flow Dependency Warnings
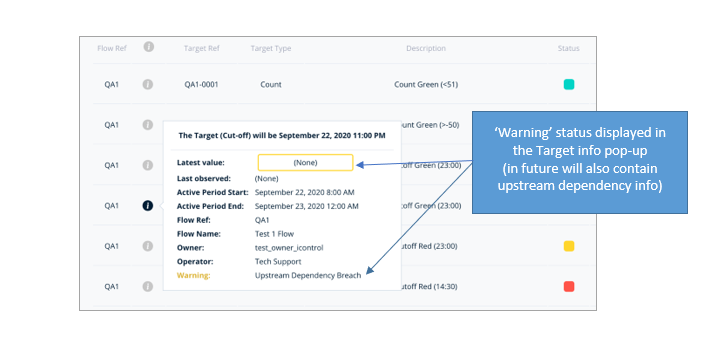
Flows and associated widgets have been enhanced to display dependency warnings and breached targets that put other (downstream) Targets within the same Flow at risk of breaching.
For example, due to the non-arrival of a file by the ‘cut-off’ time a target is breached, putting associated downstream cut-off targets within the same process flow at risk. The at risked targets are set as ‘Warning’ so that associated systems owners and operators know that upstream issues are putting their process and SLAs at risk.
There are three dependency types that have been implemented in this release. There may be further dependency types added in future. Current dependency types are as follows:
- Cascading Cut-off: Warnings will appear on all downstream Cut-off Targets when an upstream (Link or Step) Cut-off Target on a connected branch has breached
- Input Breach: Warnings will appear on all non-Uptime Targets on a Flow Step when any Target (including Uptime) on an immediate upstream ‘Link’ has breached
- Upstream Outage: Warnings will appear on:
- All non-Uptime Targets on a Flow Step or Link when an Uptime Target on an immediate upstream Step breaches
- All non-Uptime Targets on a Flow Step when an Uptime Target on an immediate upstream Link breaches
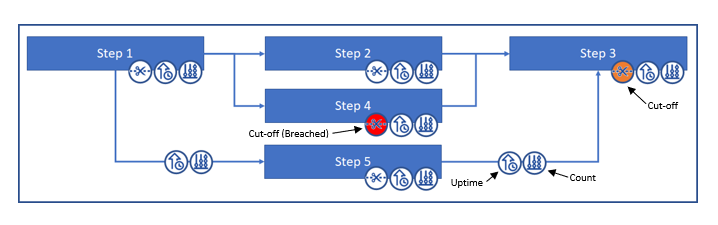
- The ‘Cut-off’ Target on Step 4 breaches
- Warnings are triggered on downstream (cut-off) Targets on Step 3
- Targets for other (non-downstream) flow branches, for example on Steps 2 and 5 are not impacted
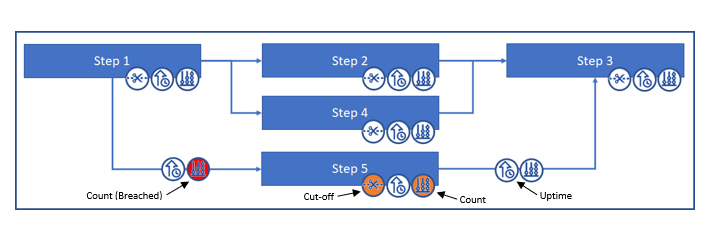
- The ‘Count’ Target on the ‘Input’ Link between Step 1 and Step 5 breaches
- Only Targets on the Step downstream from an ‘Input Breach’ on a Link Target are impacted, so:
- Warnings are triggered on downstream Cut-off and Count Targets on Step 5. Warnings would also be required if there were Throughput, Duration or Comparison Targets on Step 5.
‘Input Breach’ dependency type warnings do not impact downstream Uptime Targets.
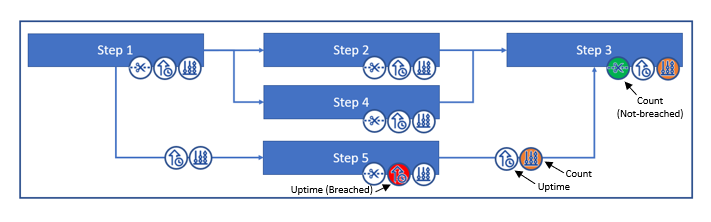
- The ‘Uptime’ Target on Step 5 breaches.
- Warnings are triggered for all non-Uptime Targets on the Link between Step 5 and Step 3.
- Warnings will also be triggered for all non-Uptime Targets on Step 3 except ‘Cut-off’ Targets already fulfilled and set to Not-breached.
- Targets on other branches, or those further downstream, are not directly impacted and therefore do not have Warnings set.
Note: Downstream ‘Cut-off’ Targets, where the associated threshold event has happened (e.g.: the file has arrived, the process has completed, etc.), are not triggered by dependencies even if they are downtream of a breached target, so once their status is set to Not-breached they cannot be set to Warning status (though a dependency is associated to the ‘Cut-off’ Target for possible Warning at the start of the next active period). Future improvements include additional information added to the tooltip to identify the target(s) and nature of the upstream breach(es) creating the target warnings.
Throughput Observation Widget
A new Throughput observation ‘rev-counter’ widget has been added and displayed in observation drill-downs. As with other observation wiiddgets, the Throughput ‘rev-counter’ can also be ‘pinned’ to dashboards if required.
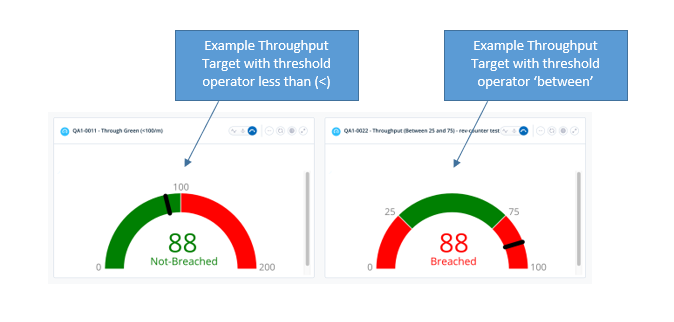
As part of the next release the Throughput ‘rev-counter’ will become the default observation widget and appear as the default widget in pop-ups (and observation modals). There will also be a ‘Count’ observation widget added for the next release.
Flow Widget ‘Pop-Ups’
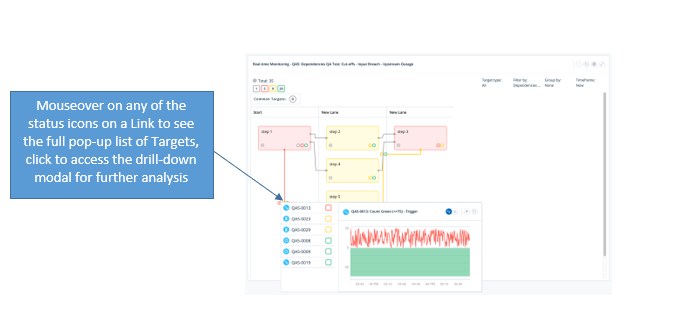
Within the Flow widget, hovering (mouseover) on target count/status icons now displays the associated target list as a ‘pop-up’ which, by using the mouseover, will display the listed target observation widgets.
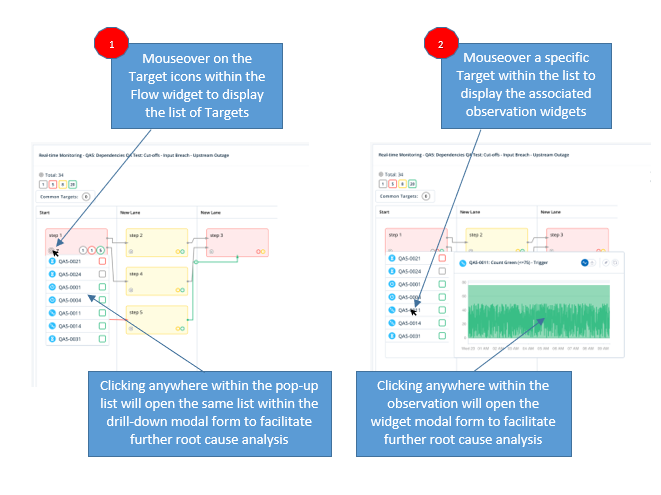
‘Pop-up’ lists are accessible from Step and Link icons within the Flow widget, as well as via the Common and (unassigned) Target buttons below the header (if present). They are not accessible from the header counts/icons, these access the standard Target drill-down modal list.
In total there were 121 JIRA tickets completed including enhancements, improvements, new fixes and features added as part of this release. Below are the key highlights.
- Added additional fields to target table endpoints including operator Id (<, >,!=, etc.) to allow for exposure of operator and threshold details within the UI, including as part of the ‘i’ tooltip details regarding a Target’s active threshold and associated operator rule.
- Target information tooltip on target lists and target observations drilldowns.
- Added Splunk KV store initialisation delay to allow for reliable start-up of Splunk/iControl.
- Added additional Splunk dashboards for (a) iControl Transaction Processing status, (b) log and index errors, and (c) trace for individual target transactions processing.
- Creating a new target within Flow Designer, now saves both the new target as well as the updated flow details so that the step or link assignment is captured immediately.
- Added Parent Ref to the textual search filter within dimension lists.
- Target create/edit reloads roles list on entry to ensure up-to-date list of owners/operators available.
- Specific lists for Cut-off Target types, ordered by threshold time instead of status to better represent the order of events within associated Flows.
- Amended the Target drill-down and Target Performance list page to include Warnings within the Latest Observation Status, aligns to dependencies as well as simplifying status filtered lists.
- Added logged-in user details to the iControl audit history (Splunk log).
- Performance improvement restrict target performance updates to only those targets that have changed.
- Performance improvement, predictions processor was running continuously, now changed to trigger prediction calculations only when required (Target life cycle start, amendments to predictive model or changes to thresholds).
- Performance improvement, removed Target List, Monitoring Point and Base Search endpoints from start-up (unless required by widgets within the default dashboard).
- The current Widget header counts for ‘Warnings’ are correct but when clicked return a blank list due to warnings being indicated within the Breach Status only and not in Latest Observation Status, resolved.
- When deleting an unassigned target from within the target list the associated reference is not being removed from the flow mapping, resolved.
- Intermittent connection refused issue sometimes causing page or widget refresh errors, resolved.
- Amended processing to ensure historical patches are not re-run if they have been previously executed even if the patch version has been reset, this stops flow schema corrections from being reset.
- Added Splunk health check prior to execution of iControl custom commands, ensures Splunk is up and running before search execution reducing the chance of a backlog causing processing delays.
- Data Stream create and edit treating the same optional ‘Latest’ field differently as well as sending ‘null’ data in the endpoint when left blank, resolved.
- Serialization causing issues with event processing for comparison targets, resolved.
- Aligned visual attributes of Targets and child Flows within the Flow widgets (and within the Flow Designer page) in preparation for implementation of child dependency monitoring and reporting.
- Breadcrumb not returning to Target Performance page from target edit form, resolved.
- Creating a flow from a Domain Pack, not populating reporting regions for Domain Pack Flows where reporting region is pre-defined for some of the Targets but not others, resolved.
- Corrected Flow names in Domain Pack where different to actual flow names.
- When selecting a Domain Pack flow and receiving an error, the error message is currently not displayed in the UI, so it is unclear what has gone wrong, resolved.
- Data Stream list page doing a ‘double take’ when rendering, rendering immediately and then re-rendering when the endpoint Data Stream list arrives, resolved.
- Various fixes and renaming of Data Stream and Base Search menu items and pages for consistency.
- Updated STR (standard tests) to align with latest Patch version.
- Updated readme files for Splunk 8 and machine learning toolkit version notes.
- Increased front-end code test coverage from 72% to 74.9%.
- Implemented upgrade patch 14, removes orphaned Targets (that have been previously deleted but have not been removed from the associated Flow object).
- Various bug fixes and UX improvement.
DRYiCE iControl dependencies:
- Splunk Machine Learning Toolkit v5 (for Splunk 8) or v4 (for Splunk 7.3.4).
iControl is a product within the emerging market sector of operational intelligence – technology solutions that leverage analytics to help end-users continuously monitor and manage business operations in real-time.
iControl forms part of a combined software and services solution developed by DRYiCE around “Business Flow Monitoring” which enables its customers to monitor, measure and report on the impact of IT performance in delivering business outcomes. Today iControl is primarily used by the project team as an implementation tool.
Business Flow Monitoring provides real time monitoring against business relevant targets. It is used by operations and technology staff on a day-to-day basis to ensure smooth running of the bank’s critical business flows to deliver end product outcomes.
Key elements of a Business Flow Monitoring implementation are to:
- Define a visual “flow” for the end-to-end business process
- Define service-level targets to set expected performance for key points within the flow
- Associate these targets with metric data provided from underlying monitoring
- Calculate real-time service-level performance and capture variance from expected level
For sales-related inquiries, please reach us at support.dryice.ai@hcl.com